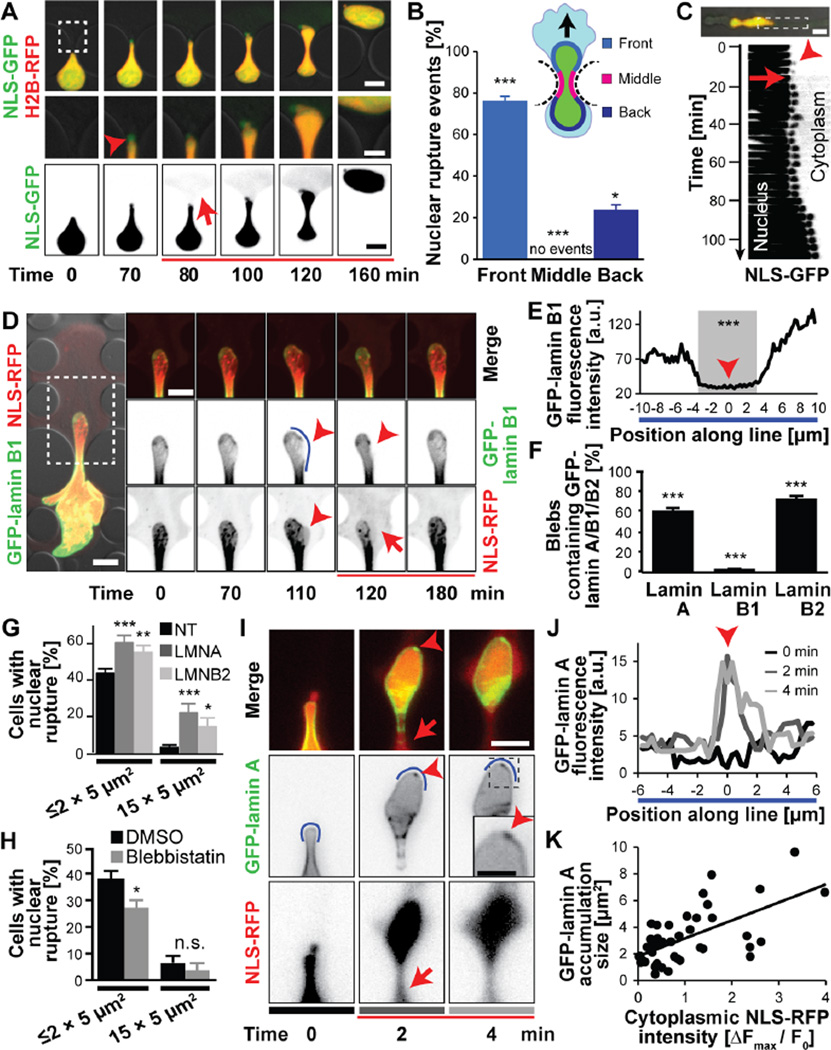
Figure 3. Molecular sequence of nuclear rupture.
(A) Nuclear membrane bleb formation (arrowhead) and collapse upon NE rupture. Scale bars: 10 µm (top and bottom rows), 5 µm (inset). (B) Distribution of NE rupture sites along nuclear periphery. Regions are based on the migration direction (black arrow) and denoted in the cartoon. n = 352 cells; *, p < 0.05; ***, p < 0.001; all comparisons relative to the hypothetical uniform distribution of 33%. (C) Kymograph of nuclear bleb formation (arrowhead) and collapse during subsequent NE rupture, corresponding to the image sequence in Fig. 1C. (D) Nuclear membrane blebs formed at sites of low GFP-lamin B1 intensity and were devoid of GFP-lamin B1 (arrowheads). Intensity along the blue line is quantified in panel E. Representative cell out of 178 cells observed. (E) GFP-lamin B1 fluorescence intensity profile. The gray area indicates the section where the nuclear bleb forms. ***, p < 0.0001; comparing values inside versus outside gray area. (F) Percentage of nuclear blebs containing detectable amounts of either lamin A, B1, B2. ***, p < 0.001; compared to the expected value of 100% for the primary nucleus; n = 178–199 cells per condition. (G) Incidence of NE rupture after siRNA treatment against lamins A/C, lamin B2, or non-target (NT) control. *, p < 0.05; **, p < 0.01; ***, p < 0.001; n = 384, 150, and 163 cells for constrictions ≤ 2 × 5 µm2; n = 166, 68, and 49 for 15 × 5 µm2 constrictions. (H) Blebbistatin treatment reduced NE rupture incidence during migration in constriction channels, but not in 15 × 5 µm2 control channels. *, p < 0.05; n = 286 and 194 for constrictions ≤ 2 × 5 µm2; n = 122, and 54 for cells in 15 × 5 µm2 constrictions. (I) GFP-lamin A accumulated at sites of NE rupture, forming ‘lamin scars’ (arrowheads). Grey bars under images correspond to line profiles at different times in (J). Scale bar: 10 µm. (J) GFP-lamin A signal intensity along a section of the nuclear rim (blue line in panel I). (K) GFP-lamin A accumulation increases with the severity of NE rupture. p < 0.0001; n = 46 cells (slope = 1.345, R2 = 0.3945). Error bars in figure: mean ± s.e.

