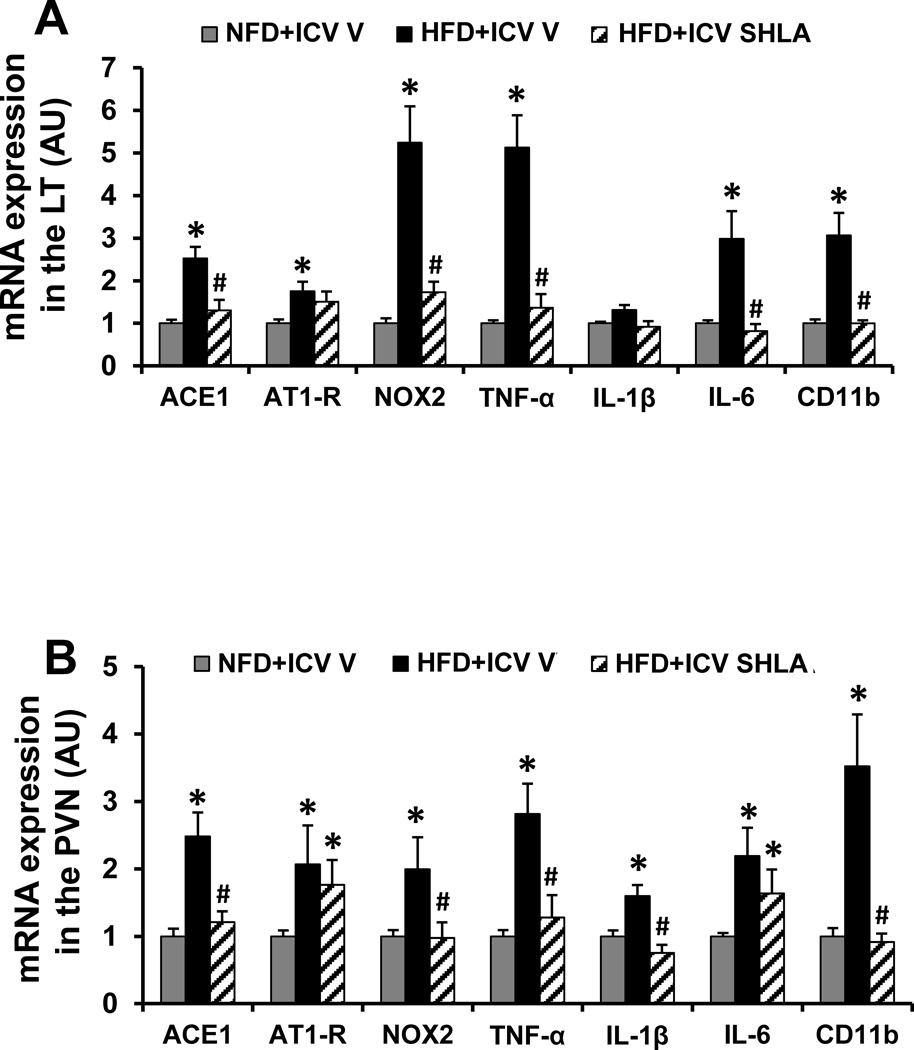
Figure 4.
Quantitative comparison of the mRNA expression of renin-angiotensin system components, proinflammatory cytokines and microglial marker in the lamina terminalis (LT, Fig 4A) and paraventricular nucleus (PVN, Fig 4B) of high fat diet (HFD) feeding rats receiving central (ICV) infusion of leptin receptor antagonist SHLA as compared with those receiving normal fat diet (NFD) feeding. (* p<0.05 vs NFD; # p<0.05 vs HFD with ICV vehicle).

