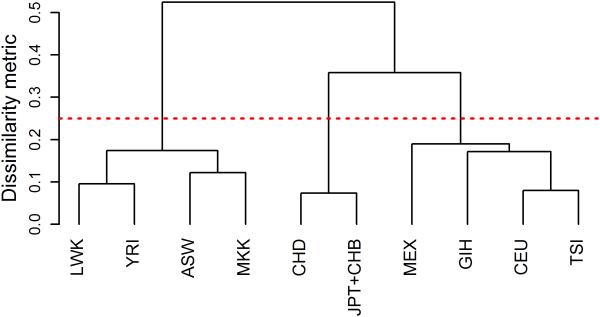
Figure 1.
Dendrogram showing the dissimilarity among ten populations from the International HapMap Project Phase 3 data. The distance between populations represents a Euclidean distance calculated using allele frequencies. A shorter distance between populations indicates closer genetic relatedness. The red dotted line indicates an arbitrary but clear fixed threshold at 0.25 in distance that leaves three clusters where studies within a cluster are relatively close to each other in their genetic relatedness. Population samples are from: African ancestry in Southwest USA (ASW); Utah residents with North and Western European ancestry (CEU); Chinese in Metropolitan Denver (CHD); Gujarati Indians in Houston (GIH); Japanese in Tokyo and Han Chinese in Beijing (JPT+ CHB); Luhya in Webuye, Kenya (LWK); Mexican ancestry in Los Angeles (MEX); Maasai in Kinyawa, Kenya (MKK); Toscani in Italy (TSI); and Yoruba in Ibadan, Nigeria (YRI).

