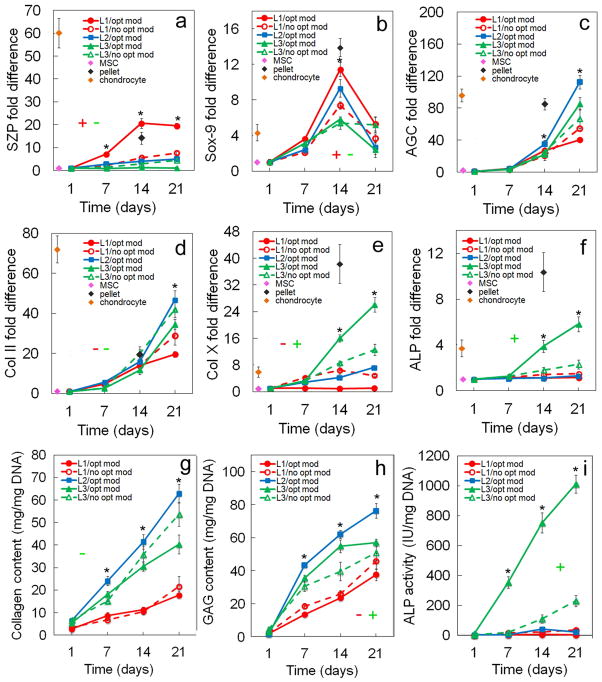
Figure 6.
Effect of matrix modulus (80 kPa for superficial, 2.1 MPa for middle, and 320 MPa for calcified zone) on zone-specific chondrogenic expression of mRNA and biochemical markers for differentiating hMSCs. mRNA markers were SZP (a), Sox-9 (b), AGC (c), Col II (d), Col X (e), and ALP (f). Biochemical markers were total collagen (g), GAG (h), and ALP (i). hMSCs were encapsulated in L1 (red), L2 (blue), and L3 (green) gels simulating the superficial, middle, and calcified zones of articular cartilage, respectively, and cultured in chondrogenic medium with (solid lines) or without (dashed lines) the corresponding optimum matrix modulus. The “without” for L1 and L3 was the middle zone modulus of 2.1 MPa which is the modulus typically used in cartilage regeneration experiments. Therefore, L2 did not have a “no opt mod” group in (a–i). The pink, brown, and black diamonds show mRNA marker expression levels of hMSCs (day zero), chondrocytes, and pellet-cultured hMSCs (day 14), respectively, as controls. An asterisk represents a statistically significant difference (P<0.05) between the test group and all other groups for the given time point. The colored “+” sign represents a statistically significant (P<0.05) positive effect of matrix modulus on the zone corresponding to that color (red for superficial, blue for middle, and green for calcified) for all time points. The colored “−” sign represents a statistically significant (P<0.05) negative effect of matrix modulus on the specified zone for all time points. Error bars correspond to means ± 1 SD for n=3.

