
Figure 5.
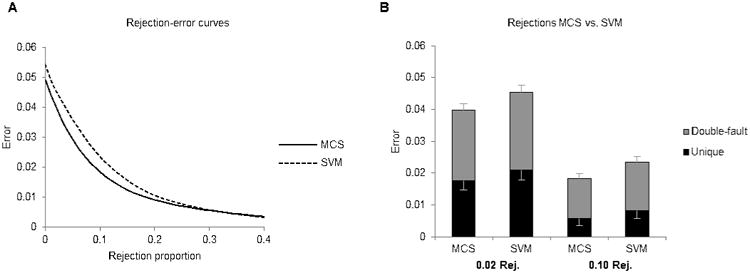
Rejections. A) Rejection-error curve displaying the trade-off between the proportion of epochs rejected and the error rate of the remaining epochs. B) Comparing MCS and SVM at two rejection rates, 0.02 and 0.10. The portion in grey designates errors which the second human also made (“double-fault” errors), and the portion in black designates errors which the algorithm made but the second human did not (“unique” errors). The lower set of error bars display the SE of unique errors, while the higher set of error bars display the SE of all errors.