
Figure 6.
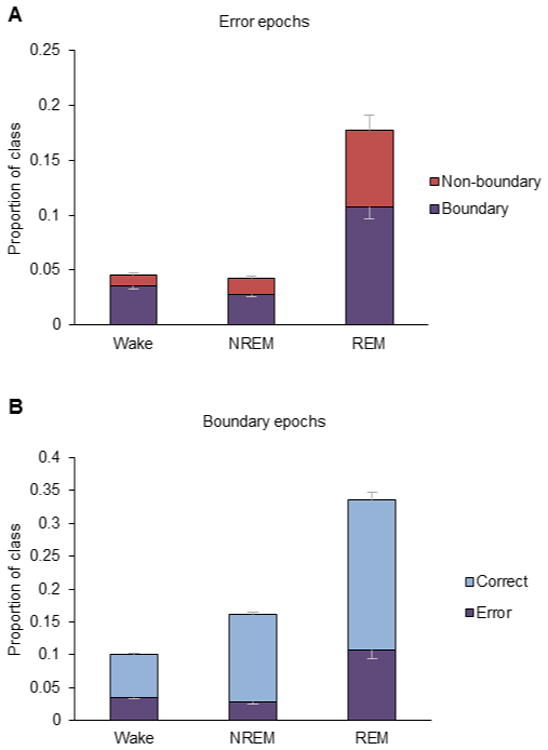
Transitional epochs and error rate. (A) The error rate is represented by the entire bar, and the fraction of those errors which were transitional epochs is represented by the purple bars. Only sensitivity errors are considered. (B) The percentage of epochs which are transitional is represented by the entire bar, and the fraction of those epochs which were errors is represented by the purple bars. Error bars are 1 SE.