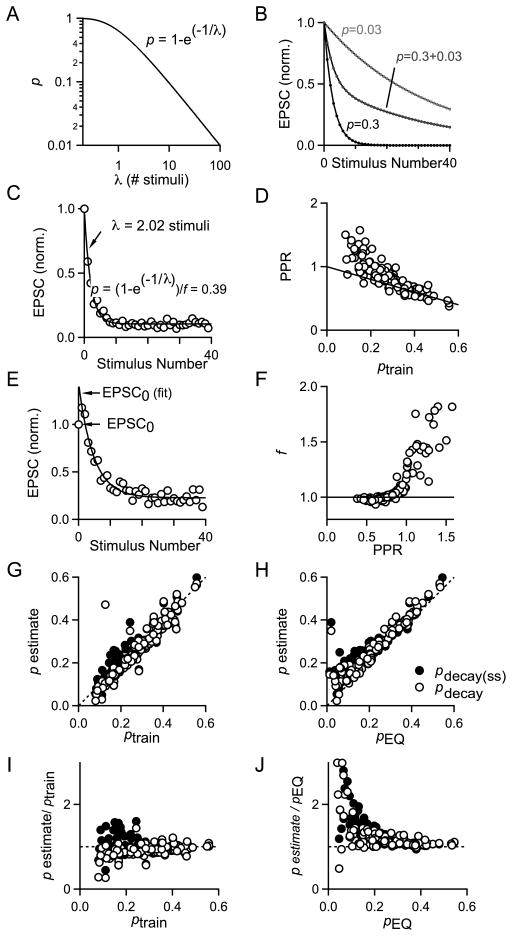
Fig. 3. A direct estimate of p and its comparison to ptrain and pEQ.
A. Plot of the relationship between initial release probability (p) and decay constant λ for a single pool of vesicles according to the equation p=1−e(−1/λ). B. Plot of EPSC amplitudes simulated for a hypothetical synapse with one pool of vesicles with a single release probability (light gray, black) or two (dark gray) pools of vesicles with different release probabilities which each comprise 50% of the total RRP. For light gray symbols and curve, p=0.03; for dark gray symbols and curve, p1=0.3 and p2=0.03; and for black symbols and curve, p=0.3. C. Plot of EPSC amplitudes versus stimulus number for 100 Hz stimulus train with single exponential curve fit. The decay constant λ is 2.02 stimuli and can be used to estimate the probability of release. D. Plot of PPR vs ptrain for experiments performed in varying Cae and in pharmacological manipulations of calcium entry (n=121). Dotted line corresponds to 1−p. E. A factor, f, was used to account for facilitation between the first and second action potentials. pdecay = pdecay(ss)/f. F. Plot of the facilitation factor, f, versus PPR for experiments performed in varying Cae and in pharmacological blockers to manipulate calcium entry (n=121). G. Plot of pdecay (open circles) and the uncorrected pdecay(ss) (black circles) versus pEQ. Dashed line indicates the unity line, n=122. H. Plot of pdecay (open circles) and the uncorrected pdecay(ss) (black circles) versus ptrain. Dashed line is the unity line. I. Plot of pdecay (open circles) and the uncorrected pdecay(ss) (black circles) normalized to ptrain versus ptrain. Dashed line is the unity line, n=122. J. Plot of pdecay (open circles) and the uncorrected pdecay(ss) (black circles) normalized to pEQ as a function of pEQ. Dashed line is the unity line, n=107.

