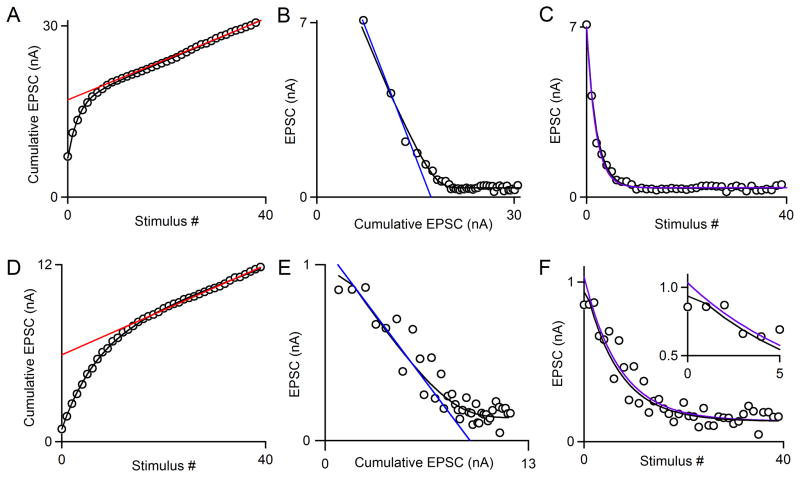
Fig. 4. Comparison of the train, EQ, and decay methods to the NpRf method.
A–C. An example of a high p synapse (pNpRf = 0.38). Raw data from synaptic responses to a single stimulus train in an example cell is shown (open circles). A. The NpRf method’s fit to data is shown (black curve). A fit to the final fifteen points of the cumulative EPSC as is used for the train method is shown (red line). B. The NpRf method’s fit to data is shown (black curve). A fit to the first four points of the data as is used for the EQ method is shown (blue line). C. The NpRf method’s fit to data is shown (black curve). A single-exponential fit to all forty points as is used in the decay method for PPR<1 is shown (purple curve).
D–F. An example of a low p synapse (pNpRf = 0.10) and the estimation of synaptic parameters. Raw data from synaptic responses to a single stimulus train in an example cell is shown (open circles). D. The NpRf method’s fit to data is shown (black curve). The train method is shown (red line). E. The NpRf method’s fit to data is shown (black curve). A fit to the second through fifth points of the data as is used for the EQ method is shown (blue line). F. The NpRf method’s fit to the data (black curve) and single-exponential fit to the second through fortieth point as is used in the decay method for PPR>1 (purple curve).

