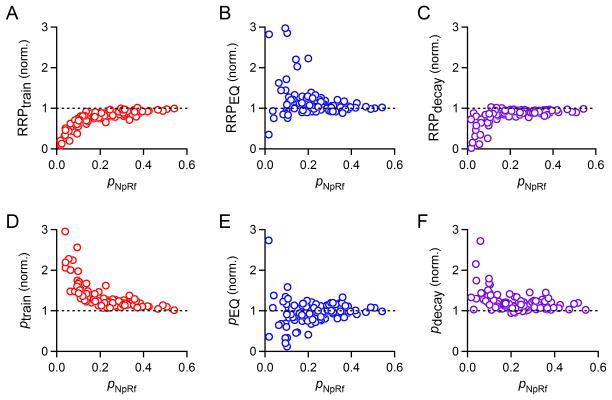
Fig. 5. Performance of a simple depletion model in comparison to train, EQ, and decay methods.
Data from many cells stimulated with 100 Hz trains in various recording conditions (same dataset as Figs. 2 and 3). A. Plot of RRPtrain normalized to RRPNpRf as a function of pNpRf, n=122. B. Plot of RRPEQ normalized to RRPNpRf as a function of pNpRf, n=107. C. Plot of RRPdecay normalized to RRPNpRf as a function of pNpRf, n=121. D. Plot of ptrain normalized to pNpRf as a function of pNpRf, n=122. E. dPlot of pEQ normalized to pNpRf as a function of pNpRf, n=107. F. Plot of pdecay normalized to pNpRf as a function of pNpRf, n=121.

