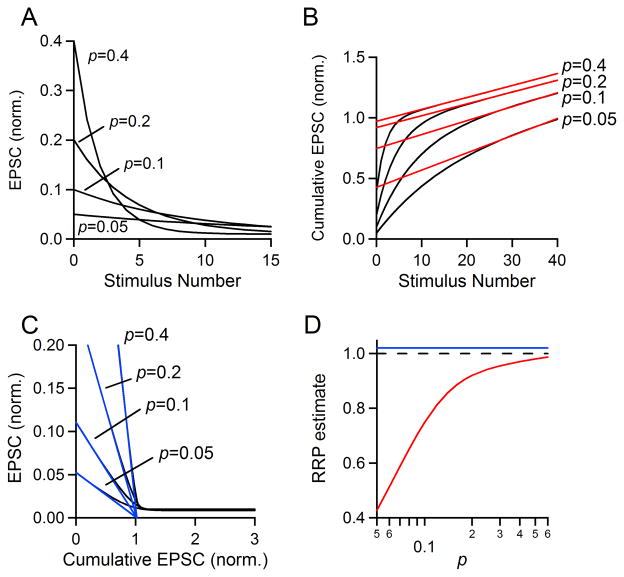
Fig. 6. Effect of changing p on estimates of RRP size.
A–C. Simulations were performed with N0 = 1, R =0.01 and p = 0.4, 0.2, 0.1, or 0.05. A. EPSC amplitudes are plotted as a stimulus number for the first 15 stimuli. B. The final fifteen points of the cumulative EPSC were fit with a line and back-extrapolated to the y axis to estimate RRPtrain. C. The first four EPSCs were fit with a line and extrapolated to the x axis to estimate RRPEQ. D. Simulations were run as in A–C (N0 = 1, R = 0.01) but for a more complete range of values of p. RRP estimate as a function of frequency for the train method (red curve) and EQ method (blue line). The actual pool size is equal to one and indicated with a dashed black line.

