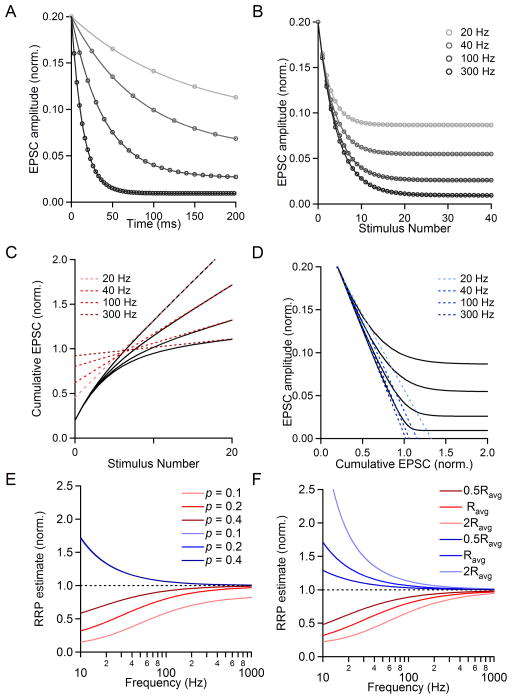
Fig. 8. Effect of changing stimulus frequency on the estimated RRP size.
Simulations were performed using the variables N0, p, and R values of {1, 0.2, R}. The value of R was changed to simulate firing at different frequencies, and was determined from our characterization of recovery from depression (see text for details). The frequencies shown are 20 Hz, 40 Hz, 100 Hz, and 300 Hz. A. EPSC amplitude (normalized to RRP size) versus time shown for simulations at different frequencies. B. Plots of EPSC size (norm. to RRP size) versus stimulus number. C. The last fifteen points of cumulative EPSCs were fit with a line and backextrapolated to x=0 to measure RRPtrain. D. Plots of the simulated EPSC amplitude versus cumulative EPSC are shown. Linear fits to the first four points of each curve are extended to y=0, indicating the value of RRPEQ. E. The measured pool size as a function of frequency for two methods of RRP estimation: RRPtrain (red) and RRPEQ (blue) for different values of p. The actual RRP size is equal to one (dashed black line). F. The measured pool size as a function of frequency as shown before for different replenishment rates (R=0.0295). The actual RRP size is equal to one (dotted black line).

