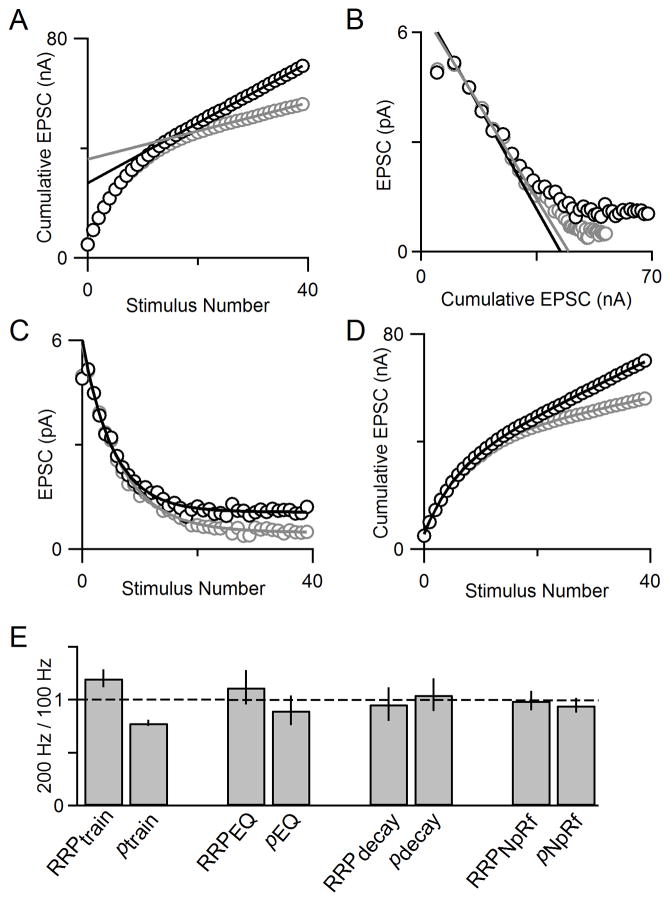
Fig. 9. Comparison of 4 methods for different stimulus frequencies.
A. Cumulative EPSC plotted for an example cell shows that RRPtrain is larger for the 200 Hz train (gray) than for the 100 Hz train (black). B. EPSC amplitude versus cumulative EPSC shows that RRPEQ is very similar for 100 Hz (black) and 200 Hz (gray) stimulus trains in an example cell. C. EPSC amplitude versus stimulus number for 100 Hz and 200 Hz trains in an example cell with single exponential fits (solid curves) according to the decay method. D. Cumulative EPSCs with model fits plotted for 100 Hz (data shown as gray open circles and model fit as a gray line) and 200 Hz (data shown as black open circles and model fit as a black line) can be used to estimate RRP size. E. Summary data for all four techniques of measuring RRP size (n=4).

