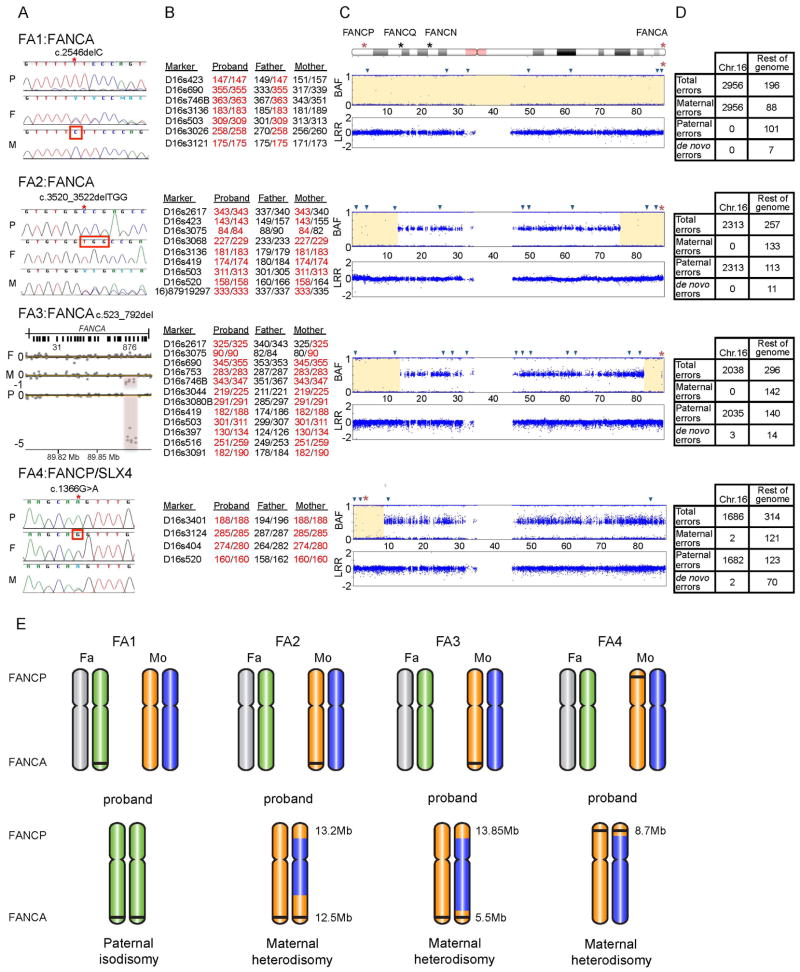
Figure 1. Homozygous mutations resulting from UPD of chromosome 16 in four FA patients.
A. Homozygous mutation in each proband and the heterozygous carrier status of each parent. For each family, data from the proband (P), father (F), and mother (M) are shown. Families FA1, FA2, and FA3 carry mutations in FANCA, and family FA4 carries a mutation in FANCP/SLX4. Sequence traces from Sanger sequencing are shown for families FA1, FA2, & FA4. The red star indicates the mutation site, homozygous in the proband and heterozygous in the carrier parent, and the red square indicates the presence of the WT sequence in the non-carrier parent. ArrayCGH intensity plot is shown for FA3 family. The red-shaded region indicates the site of deletion, and the length of the shaded region shows the state of zygosity: a heterozygous loss in the parental carrier and a homozygous loss in the proband.
B. Genotypes of proband/parents trio using chromosome 16 STRP markers. The markers and their two alleles in each member of the family are shown. The alleles of the proband are marked in red to emphasize the parent from whom they were inherited. Only the informative markers from STRP analysis are shown. The full list of tested markers is provided in Supp. Table S2. The positions of the informative markers on chromosome 16 are represented by blue triangles in Figure 1C.
C. Probands’ chromosome 16 SNP genotype data. An ideogram of chromosome 16 indicating the location of the four FA genes. The two affected genes in these four families, FANCA and FANCP/SLX4, are marked with a red asterisk. The top plot, for each proband, is the B Allele Frequency (BAF) showing the state of zygosity for each SNP. A BAF of 1 or 0 indicate a homozygous genotype, whereas a BAF of 0.5 indicates a heterozygous genotype. The bottom plot is the Log R Ratio (LRR) which shows the SNP intensity and represents the allelic copy number. A LRR of 0 indicates a copy number of two. The regions of isodisomy are highlighted in yellow.
D. Mendelian errors in the probands’ SNP genotypes. A mendelian error is identified as the presence of a genotype in the proband that cannot be explained by a classical inheritance pattern from both parents. The table shows the number of errors present in chromosome 16 in comparison to the number of errors present throughout the rest of the genome. Comparing the number of errors contributed from each parent elucidates whose chromosome 16 is absent from the proband.
E. Graphical representation of the likely mechanism leading to UPD in each family. The two chromosome 16 homologues of each parent and their presence in, or absence from, the proband are shown. The location of FANCA and FANCP/SLX4 are indicated, and the mutation is indicated with a black line. The sizes of the isodisomy regions in probands FA2-FA4 are presented in megabases. The complete paternal isodisomy in FA1 may have been generated by a mechanism involving monosomy rescue: maternal nondisjunction results in no chromosome 16 (nullisomy), leading to monosomy of paternal chromosome 16, which would be lethal and would be rescued by duplicating the paternal chromosome 16(Engel, 2006). The maternal heterodisomy in FA2, FA3, and FA4 may be explained by a mechanism involving trisomy rescue: where a supernumerary chromosome from a trisomic conceptus is lost, leaving behind two homologues from the same gamete (Engel, 2006). The homozygous regions distal to the crossover events during meiotic recombination appear as isodisomic regions in the pter of FA4 (a single crossover), and the pter and the qter of FA2 and FA3 (two crossover events). This reduction to homozygosity, of the regions harboring the FANCA (FA2 and FA3) and FANCP/SLX4 mutations (FA4), leads to FA.

