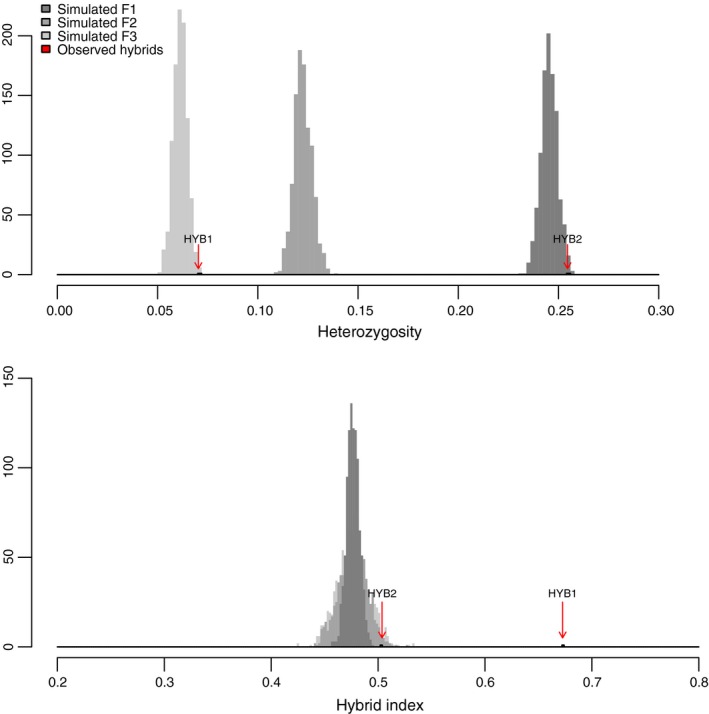
Figure 4.

Distributions of individual observed heterozygosity (top panel) and hybrid index (bottom panel) for a simulated cross between Group 2 and Group 3. F1 (dark gray) are simulated first‐generation hybrids, and F2 (medium gray) and F3 (light gray) are after one and two generations of selfing, respectively. Values for observed hybrids found in the 2013 dataset (HYB1 and HYB2) are marked with arrows.
