Figure 4.

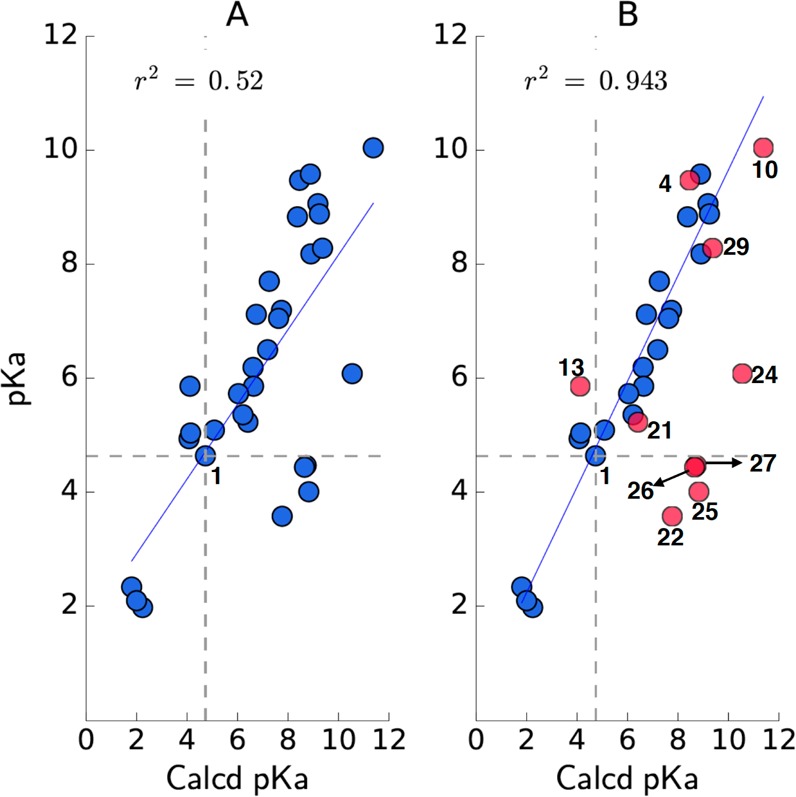
Comparison between experimental and calculated pKa values; (A) the linear regression for the entire data set; (B) the linear regression when major outliers (i.e., discrepancy >1 log unit, shown in red) are excluded.

Comparison between experimental and calculated pKa values; (A) the linear regression for the entire data set; (B) the linear regression when major outliers (i.e., discrepancy >1 log unit, shown in red) are excluded.