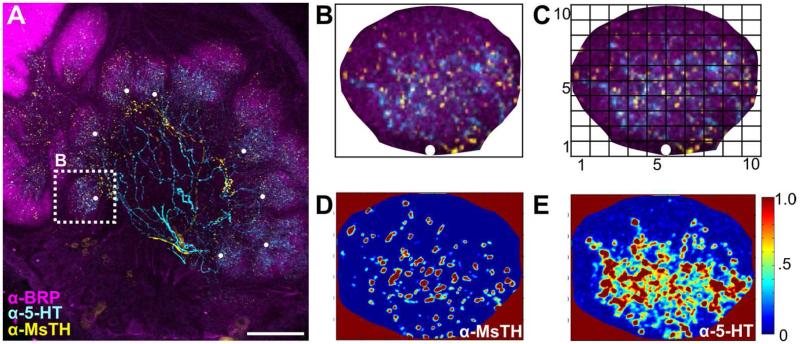
Figure 2.
Depiction of Intensity Distribution Analysis. A: Example .tif stack of an AL scan with glomeruli marked with a white dot at their most proximal, central point. B: Cropped glomerulus, marked in Fig. 2A, oriented such that the white dot is at the “6 o’clock” position to ensure that horizontal bin 1 always corresponds to the most proximal end of the glomerulus and horizontal bin 10 to the most distal. A white bordered square was placed with edges flush to the cropped glomerulus. The square is shown as black here to visualize concept. C: The area innervated and the density of pixels for each modulator was determined across a 10×10 matrix using a custom MatLAB script. Horizontal Bin 1 is most proximal, while horizontal bin 10 is most distal. D: MatLAB determined intensity values for MsTH-ir. E: MatLAB determined intensity values for 5-HT-ir. Scale bar = 100 um.

