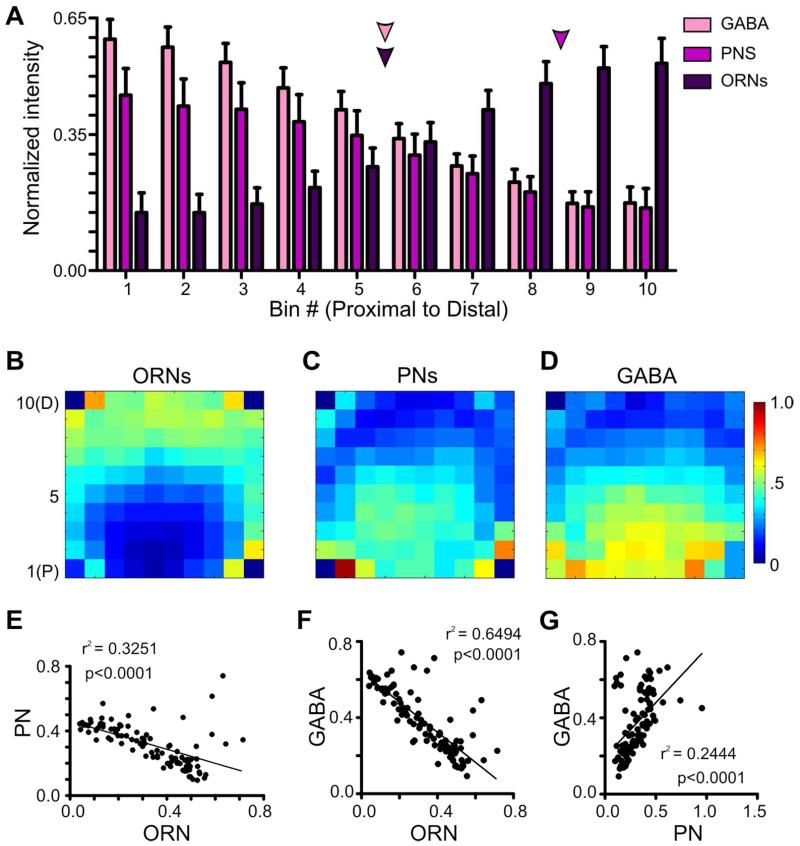
Figure 4.
The anatomical boundaries of ORNs, PNs and GABA-ir. A: Label intensity for ORNs,, PNs and GABA-ir along the proximal (bin 1) to distal (bin10) axis of a glomerulus. ORN intensity values began to significantly decrease relative to the most distal bin at bin 6 (1-way ANOVA; p<0.05, df=9, n=10). PNs intensity values began to significantly decrease relative to the most proximal bin at bin 9 (1-way ANOVA; p<0.05, d=9, n=10). GABA intensity values began to significantly decrease relative to the most proximal bin at bin 5 (1-way ANOVA; p<0.01, df=9, n=10). Colored arrows denote where the intensity of each neuronal type begins to significantly reduce. B-D: Averaged 10×10 intensity plots for each neuron type (ORN, PN and GABA-ir, respectively. n=10 each). Blue denotes low intensity values, while red denotes high intensity values. B: 10×10 intensity plot for ORNs. C: 10×10 intensity plot for PNs. D: 10×10 intensity plot for GABA-ir. E-G: Linear regressions of the average intensities across the 10×10 intensity plots of ORNs, PNs and GABA-ir. E: The innervation patterns of ORNs and PNs display a negative relationship (r2 = 0.3251, p<0.0001, n=10 glomeruli, 5 animals). F: ORNs and GABA display a negative relationship (r2 = 0.6494, p<0.0001, n=10 glomeruli, 5 animals). G: The innervation patterns of PNs and GABA display a positive relationship (r2 = 0.2444, p<0.0001, n=10 glomeruli, 5 animals).

