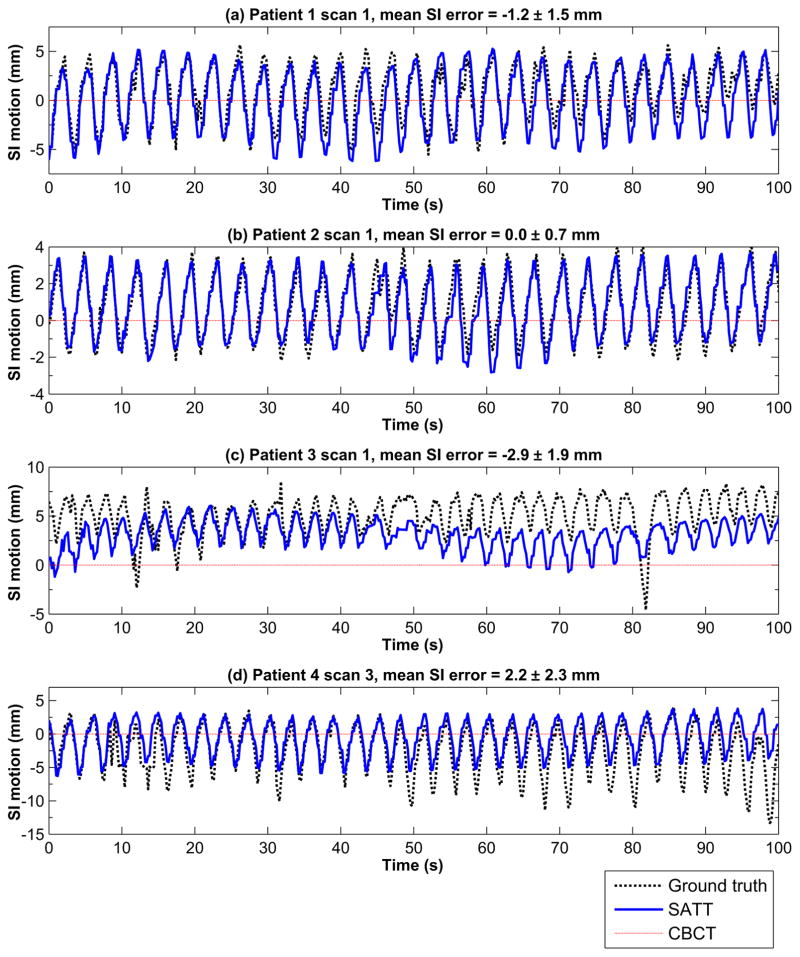
Figure 3.
A hundred seconds of four example tracking trajectories in SI (one from each patient). The time-averaged marker centroid position in the pre-treatment CBCT imaging session is represented by the red dotted horizontal line. The SI motion was plotted with the pre-treatment CBCT position shifted to 0 mm.

