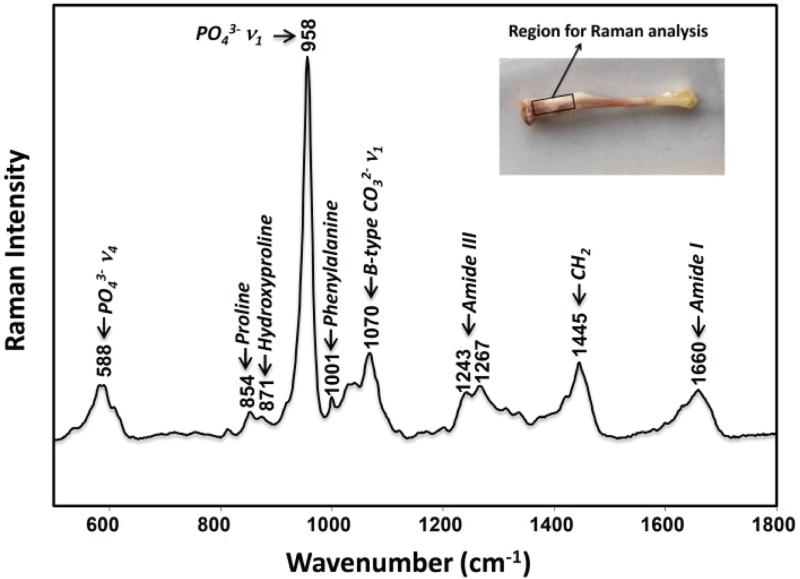
Figure 1.
Representative Raman spectrum of cortical bone from a control tibia specimen. The bone Raman spectrum contains bands corresponding to the carbonated apatite bone mineral and collagen matrix. For this study, Raman spectra were collected from the proximal tibia of the mouse, shown in the inset.

