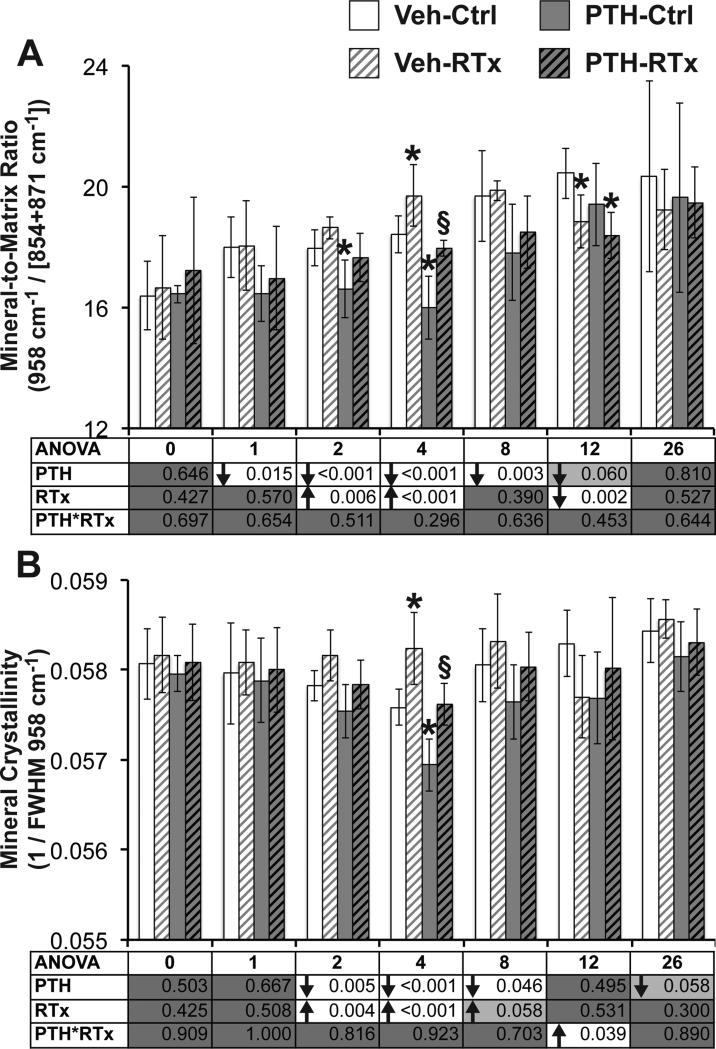
Figure 3.
(A) Mineral-to-matrix ratio was transiently increased by radiation at weeks 2 and 4, and decreased by PTH treatment from weeks 1–8. (B) Mineral crystallinity was transiently increased at weeks 2–4 by radiation, and decreased in response to PTH at weeks 2–8. Data are presented as mean ± standard deviation, with ANOVA presented in tables underneath each graph. Tukey's post-hoc pairwise comparisons within each time point are identified as follows: * denotes p < 0.05 vs. VEH-Ctrl; § denotes p < 0.05 vs. VEH-RTx.

