
Figure 1a. Person-item-thresholds distribution for rhytides overall by response to question: “How the lines on your face look overall?”.
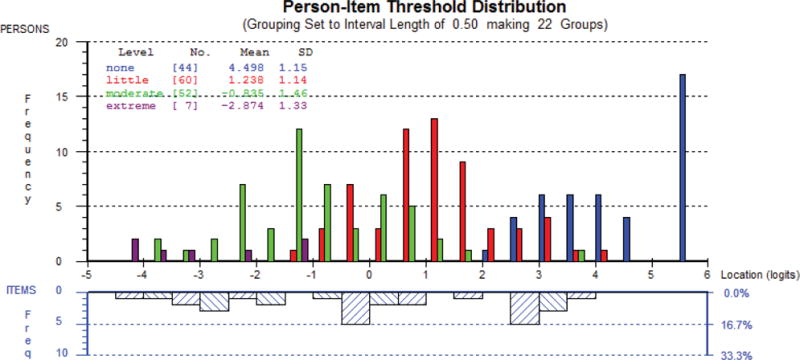
This figure shows a different pattern of responses for each of the response options, e.g., those “extremely bothered” by rhytides scored the lowest on the scale, and those “not at all bothered” scored the highest on the scale.