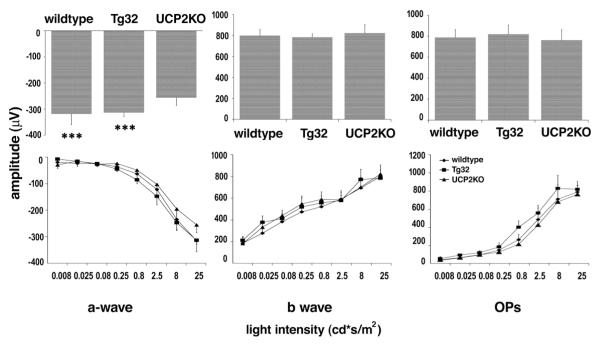
Figure 2.
Electroretinograms of wild type, UCP2 transgenic and UCP2 knockout mice. Average amplitudes of ERG a-wave (left), b-wave (middle), and OPs (right) recorded from wild type, Tg32 and UCP2KO mice evoked by 25 cd * s/m2 flash light stimulus. The variation of response with light intensity is shown in the lower traces.

