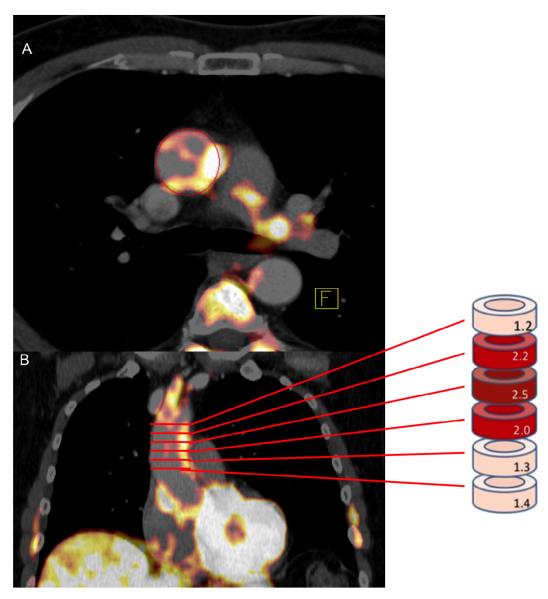
Figure 2.
Image of PET analysis. SUV is measured in wall of the Ascending aorta in the axial plane (A) starting 1 cm above the origin of coronary vessels and continuing to the bottom of the aortic arch in 5 mm increments (B). Arterial FDG uptake was recorded as a mean of maximum standardized uptake values (SUVmax) of all the slices.

