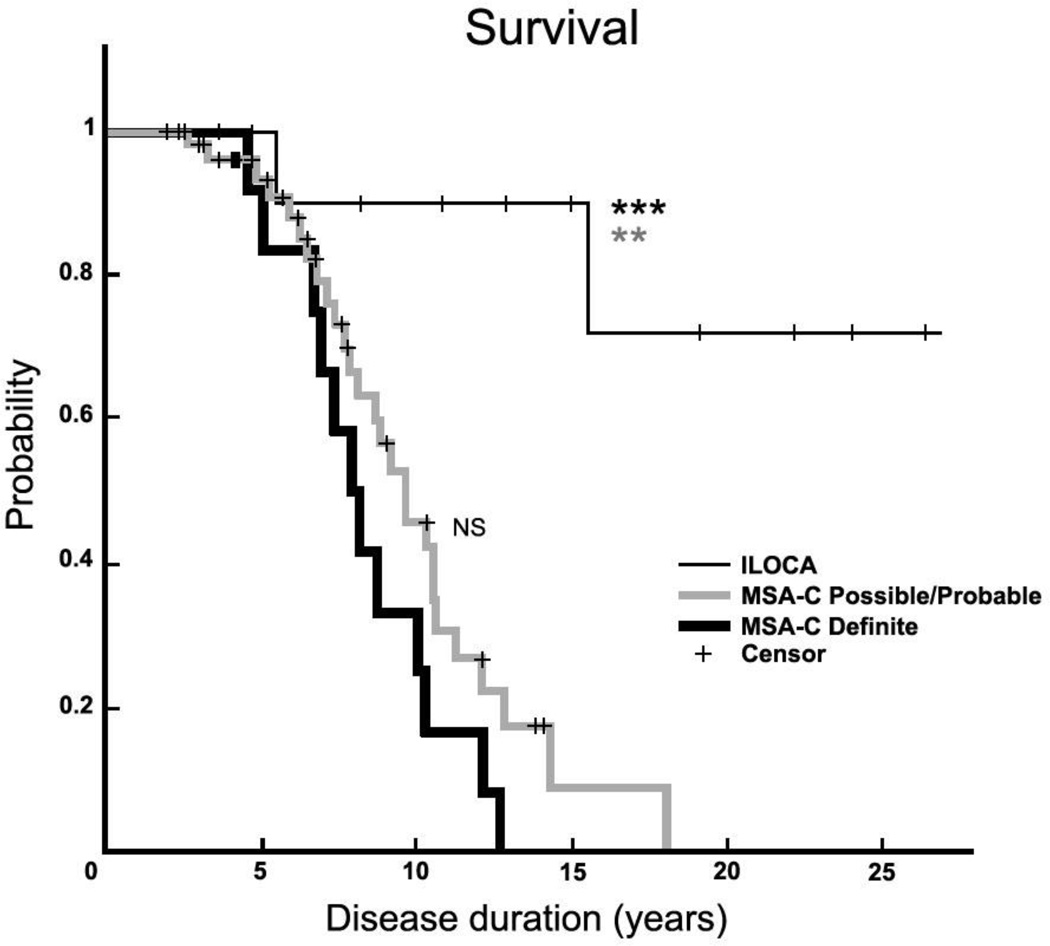
Figure 1. Survival plots in MSA-C and ILOCA.
Kaplan-Meier graph showing survival in patients with ILOCA (n=12, thin black line), Possible/Probable MSA-C (n=53, gray line), and Definite MSA-C (n=12, thick black line). Disease duration denotes years from symptom onset. NS, there is no significant difference (p = 0.15, log-rank test) between survival of Definite MSA-C (median survival 8.1 years) and Possible/Probable MSA-C (median survival 8.6 years). Patients with ILOCA have significantly longer survival than either patients with Definite MSA-C (p<0.001) *** or patients with Possible/Probable MSA-C (p=0.001) **. + denotes censored data points.

