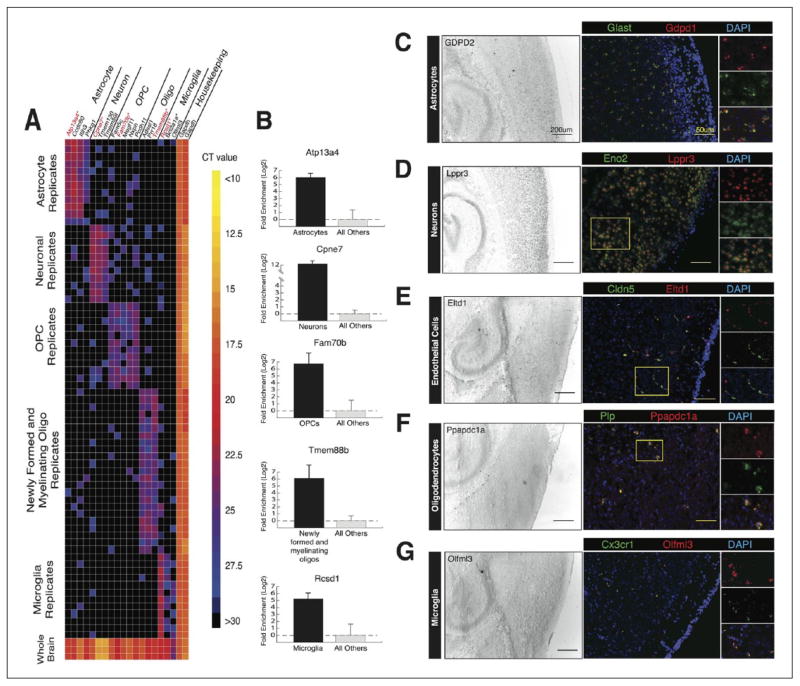
Figure 4.
Validation of cell-type enriched genes from RNA-Seq results by qRT-PCR and in situ hybridization. (A) 34 of the selected 40 newly identified cell-type enriched genes were validated by qRT-PCR using Fluidigm BioMark microfluidic technology. Warmer colors represent higher abundance transcripts, and cooler colors represent lower abundance transcripts. Black indicates no amplification. (B) Fold enrichment plots for Atp13a4, Cpne7, Fam70b, Tmem88b, and Rcsd1 compared to housekeeping gene Gapdh. (C–G) In situ hybridization showing the colocalization of novel cell-type specific genes with classical cell markers. Left, image of the cortex and hippocampus at low magnification. Scale bar, 200 μm. Right, image of the cortex at high magnification. Scale bar, 50 μm. Adapted from Zhang and others (2014) with permission and modifications.

