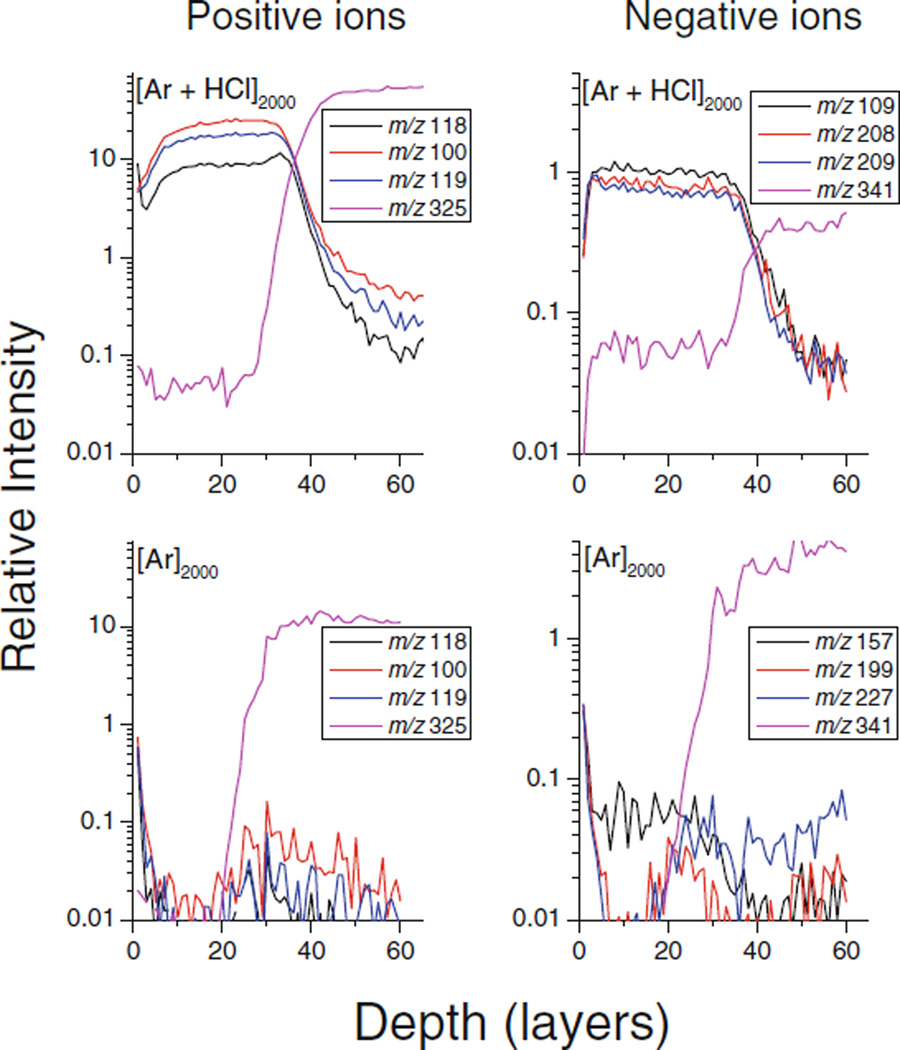
Figure 1.
Molecular depth profiles of positive and negative water cluster ion peaks at m/z 100, 118, 119 (positive) and 109, 208, 209 (negative) measured for a D2O ice overlayer deposited onto a trehalose film. The signals at m/z 325 (positive) and 341 (negative) correspond to [M−OH]+ and [M−H]− ions of trehalose

