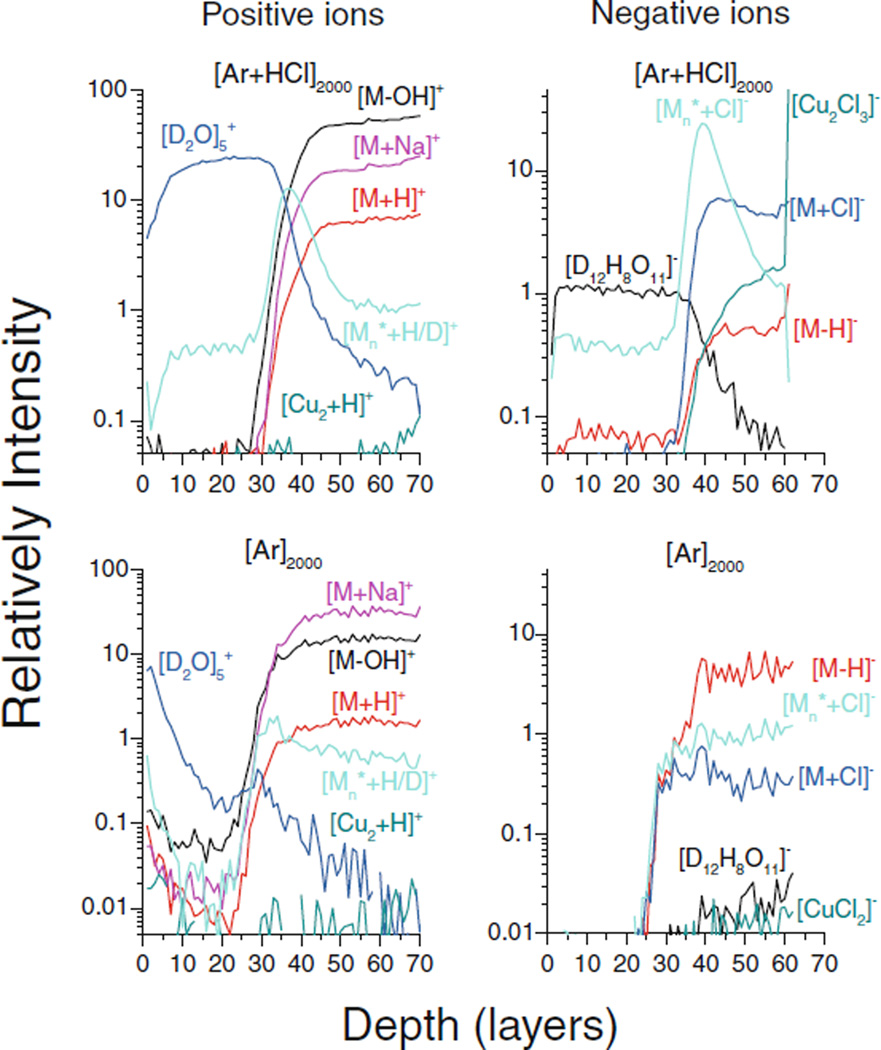
Figure 3.
Depth profiles of selected secondary ion signals measured on a trehalose film on Cu capped with a D2O overlayer. The notation Mn* describes the exchange of H and D in the trehalose molecule M, where n H atoms have been replaced by D atoms, and the curves labeled [Mn* + H/D]+ and [Mn* + Cl]− denote the sum of all such signals (m/z 344 + … + 349 and m/z 380 + … + 387, respectively). Note the maxima occurring for these signals near the 40 layer point associated with the water/trehalose interface are only present with the HCl doped Ar2000 GCIB

