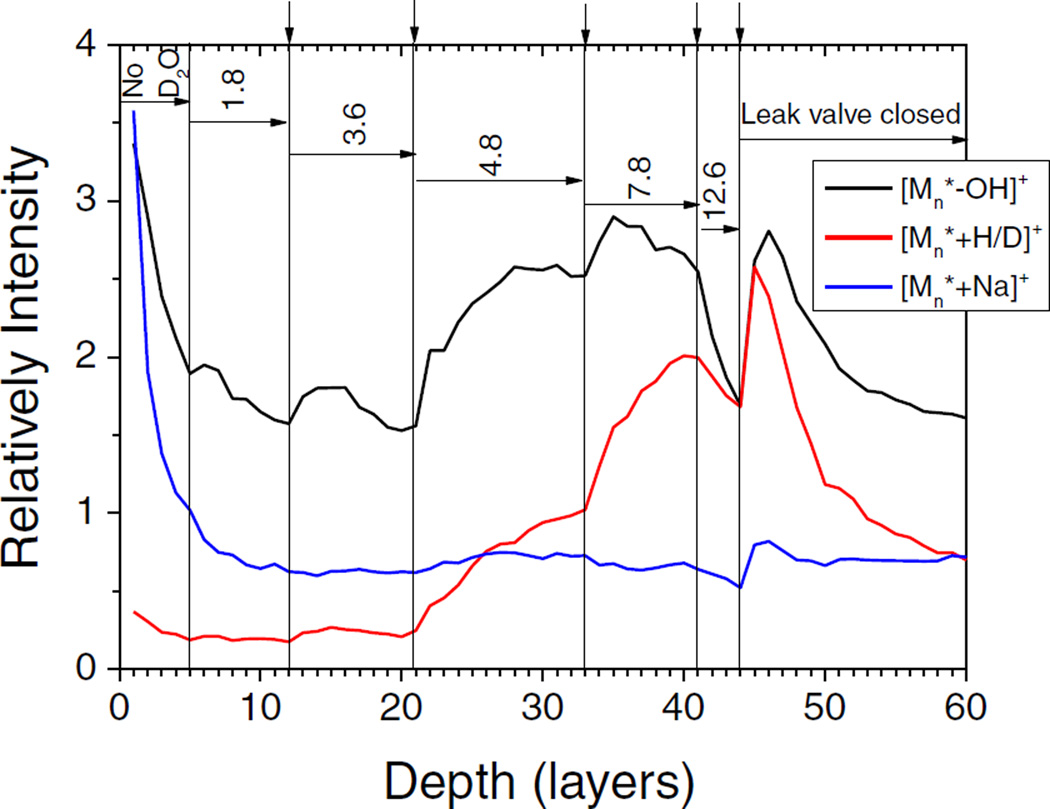
Figure 5.
Summed signal of peak groups displayed in Figure 6 corresponding to [Mn*−OH]+, [Mn* + H/D]+, and [Mn* + Na]+ (n = 1–8, for definition of Mn* see Figure 4) versus eroded depth while profiling through a trehalose film on copper with an HCl doped Ar2000 GCIB at 110 K under simultaneous flooding with D2O at different partial pressures. The vertical lines mark the times at which the flooding gas partial pressure was changed, the numbers denote the D2O partial pressure in units of 10−7 mbar

