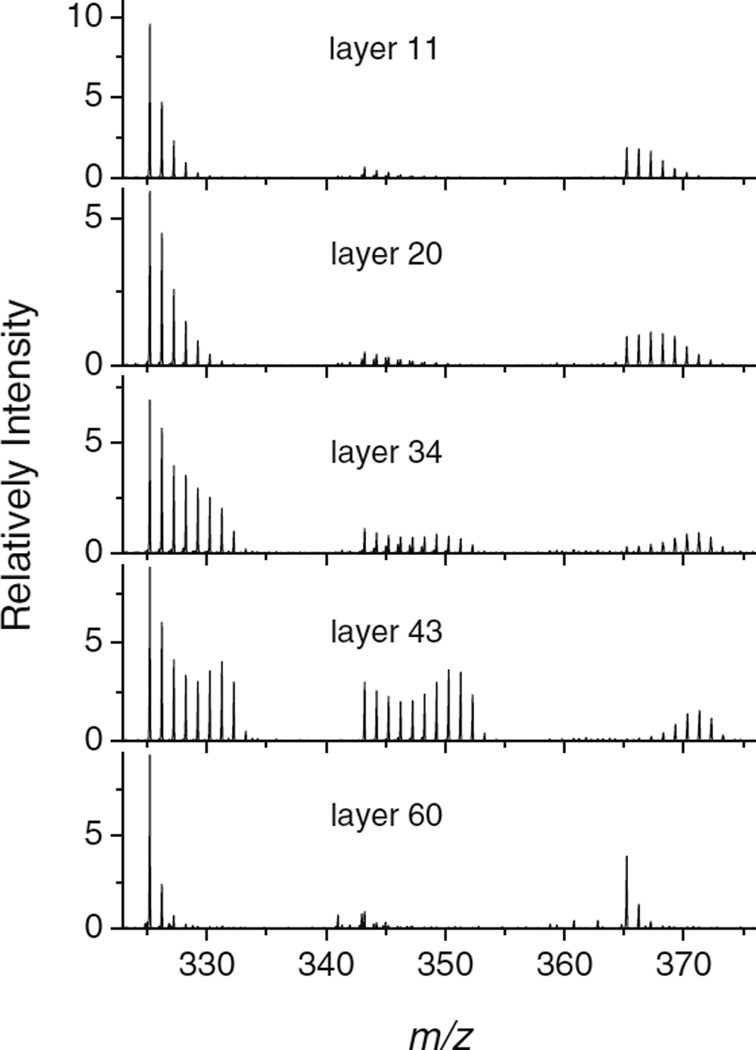
Figure 6.
Mass spectra measured at the designated points of the dynamical depth profile displayed in Figure 5. The data were taken with the HCl doped Ar2000 GCIB at 110 K under simultaneous flooding with D2O at different partial pressures. The three displayed peak groups correspond to the [Mn*−OH]+, [Mn* + H/D]+, and [Mn* + Na]+ (for the definition of Mn* see Figure 4) secondary ion signals

