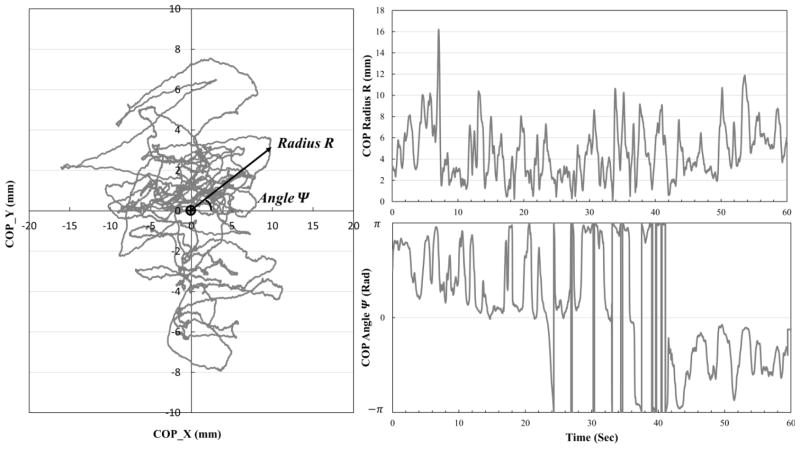
Figure 1.
(Left) Diagram of the two time-series (radius R and angle Ψ) used in the analysis. The radius R is calculated for each point in time as the distance from the mean of the entire COP trace to that point. Similarly, the angle Ψ was calculated for each point in time using the mean of the time series as the origin. (Right) The one dimensional time-series R (upper right) and Ψ (bottom right) for one individual during eye’s open quiet standing.

