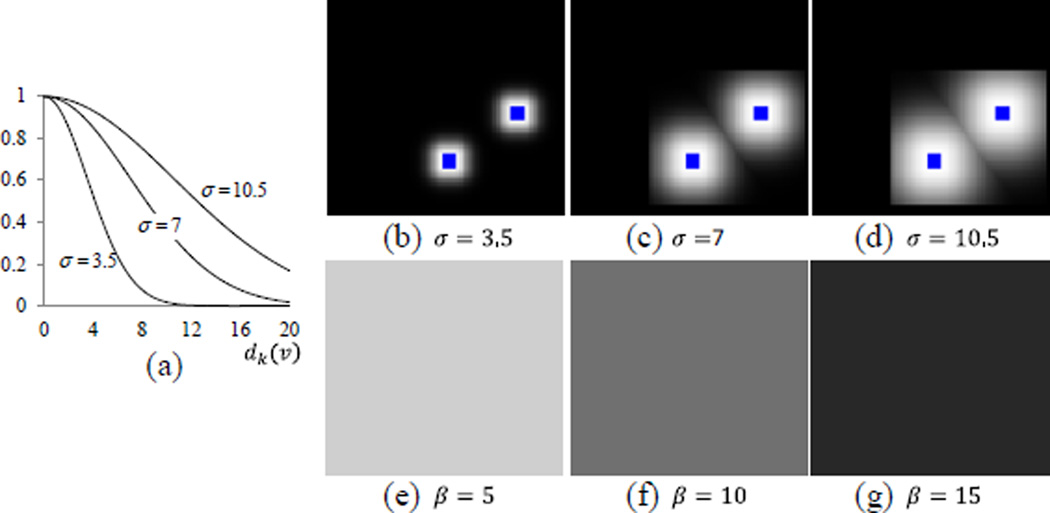
Fig. 4.
The voting weight maps for different σ and β. The graph of exponential functions with different σ is shown in (a). For the three different values of σ, their respective weight maps are obtained with respect to the distance dk(v) to the user interactions (blue dots) and are shown in (b), (c), and (d), respectively. For three different values of β, their respective weight maps are obtained and shown in (e), (f), and (g), respectively, when using σ = 7.

