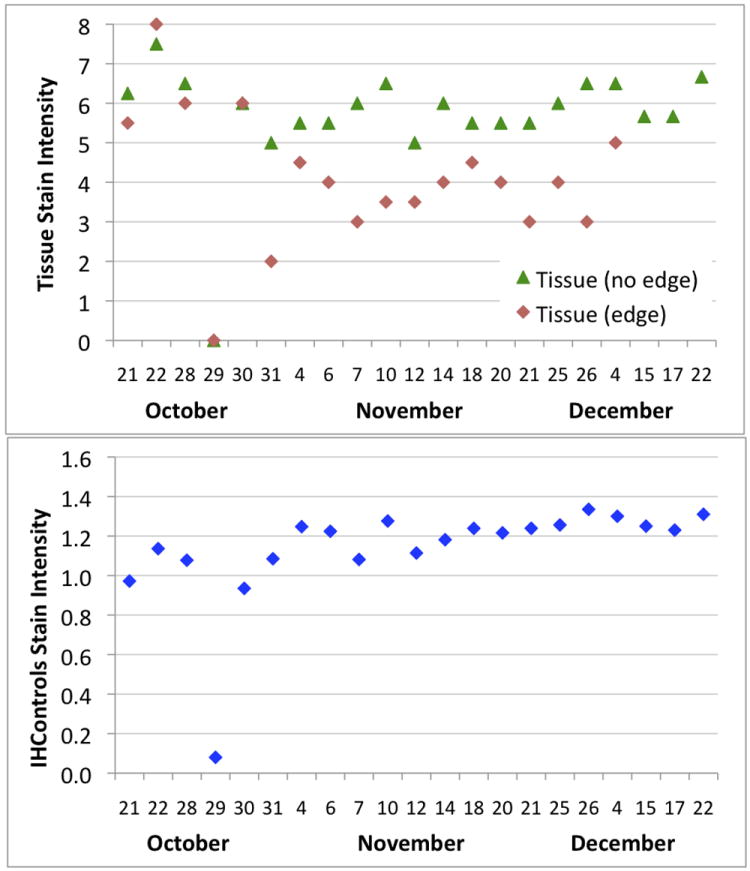
Figure 1.

Levey-Jennings graphs at institution 1, monitoring HER-2 stain intensity day-to-day for tissue controls (upper panel) and antigen-coated beads (“IHControls”, lower panel). The October 29 run did not stain properly, as detected by both types of controls. The tissue controls’ stain intensity graph (upper panel) is stratified into two separate curves, segregating out an area of tissue at the edge of the section. These curves diverge, starting October 31. Each data point is the mean of a single quality control.
