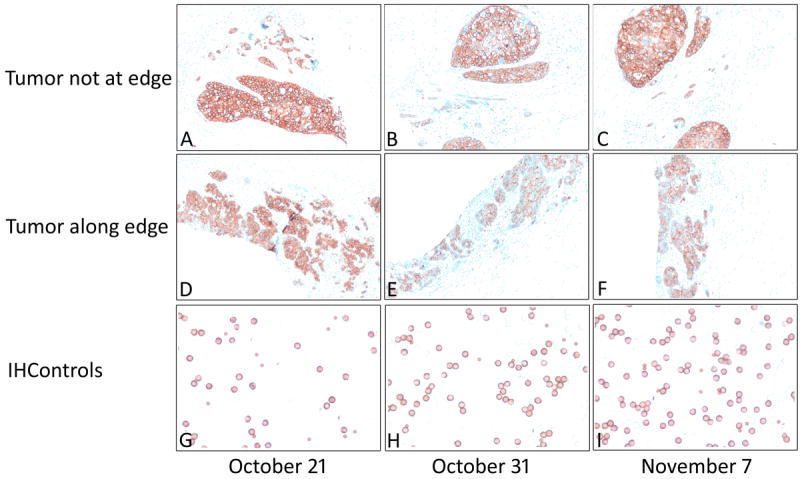
Figure 2.

Photomicrographs of HER-2 control tissue (upper and middle panels) and antigen-coated beads (“IHControls”, lower panel) on 3 different days in 2014 (the specific dates as indicated along the lower margin). The photomicrographs depicted in the upper and middle panels are from the same tissue section but separated by several millimeters. Panels E and F show markedly lower staining. Original magnification for tissue controls 100X (upper panel) and for antigen-coated beads 400X (lower panel).
