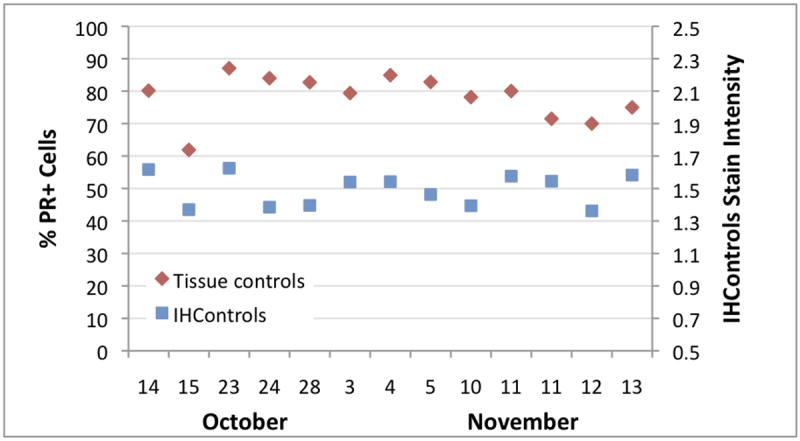
Figure 3.

Levey-Jennings graph at institution 2, depicting the PR staining percentage (left-hand vertical axis) and antigen-coated beads PR stain intensity (“IHControls”, right-hand vertical axis) during October and November, 2014. Each data point is a single quality control, as per the routine for the laboratory’s operations. The drop in %PR+ cells on October 15 is due to increased counterstain intensity, not the immunostain itself. There is a slight decrease in the antigen-coated beads on that day relative to the day before and after, but the score is still within the mean ± 2SD for that parameter. Cellular PR staining of the tissue control for that day is strong.
