
Figure 5.
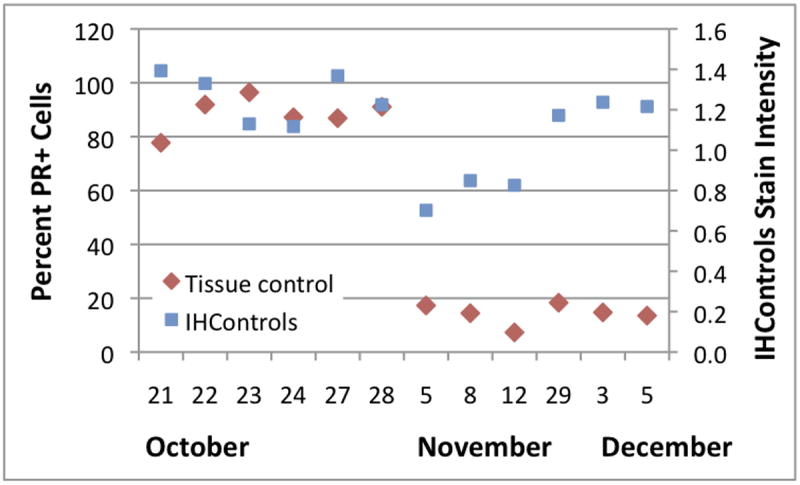
Levey-Jennings graph at institution 3, depicting the PR staining percentage (left-hand vertical axis) and antigen-coated beads’ PR stain intensity (“IHControls”, right-hand vertical axis) during October - December, 2014. Each data point is a single quality control, derived from the mean of 3 - 4 images.