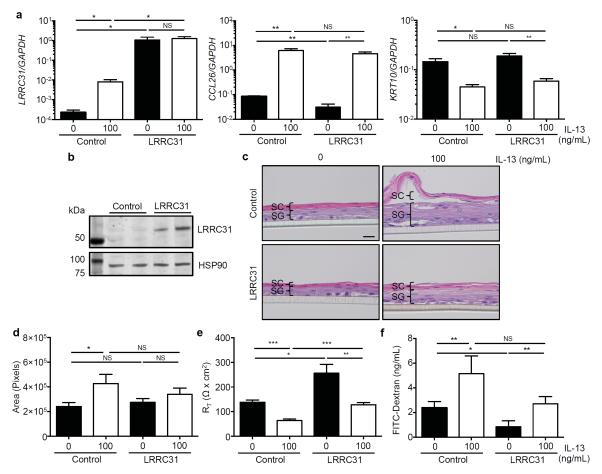
Figure 6. Epithelial barrier function in differentiated LRRC31-overexpressing EPC2 cells.
EPC2 esophageal epithelial cells transduced with either empty vector (control) or flag-epitope tagged LRRC31 lentiviral expression constructs were cultured as described in Figure 5b. a, Normalized LRRC31, CCL26, and KRT10 mRNA expression in differentiated control and LRRC31-overexpressing (LRRC31) EPC2s at day 14 determined by qPCR analysis. A representative experiment shown (n = 3). b, LRRC31 (61.5 kD) protein expression in differentiated control and LRRC31-overexpressing EPC2s at day 14 determined by western blot analysis. Image shown is a representative experiment (n = 3); HSP90 (90 kD) loading control is shown. Left lane is the molecular weight ladder. c, H&E staining of differentiated control and LRRC31-overexpressing EPC2s at day 14. Scale bar represents 20 μm. A representative experiment is shown (n = 3). d, Cross-sectional area of H&E stained sections from differentiated control and LRRC31-overexpressing EPC2s at day 14. A representative experiment is shown (n = 3). e, TER measured across differentiated control and LRRC31-overexpressing EPC2s at day 14. A representative experiment is shown (n = 3). RT, resistance. f, FITC-dextran (3-5 kD) paracellular flux measured at 3 hours after FITC-dextran was added to luminal surface of differentiated control and LRR31-overexpressing EPC2s at day 14. A representative experiment is shown (n = 3). For a and d-f, data are represented as the mean ± SEM; NS, not significant; *P < 0.05, **P < 0.01, ***P < 0.001.

