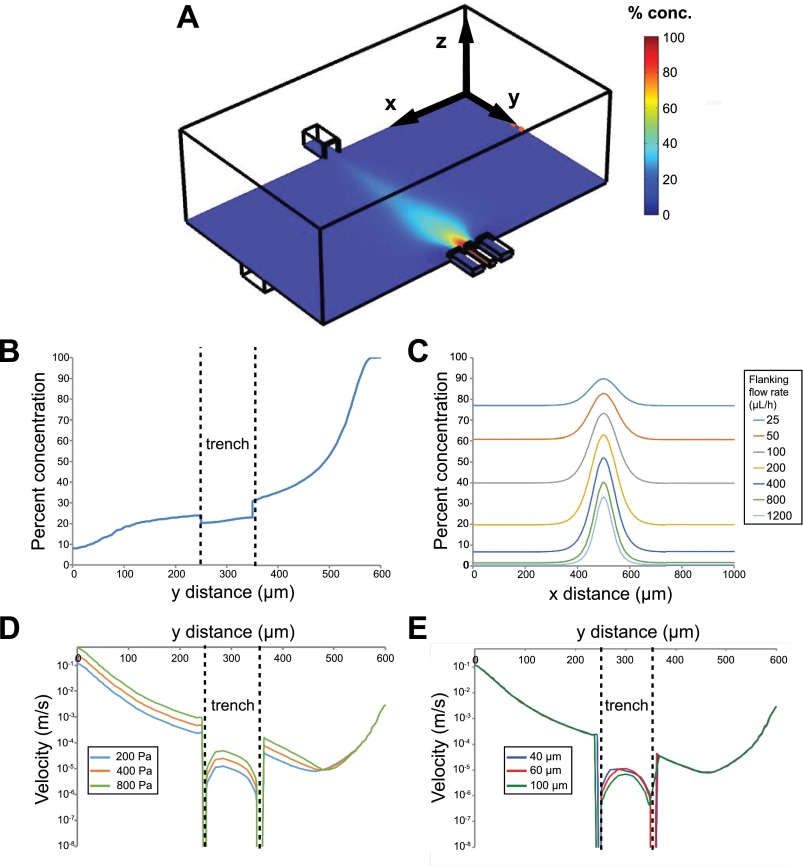
FIG. 4.
Computational simulations of local concentrations and velocities. (a) An isometric view of one microjet unit, showing focal and flanking channels on the bottom right and vacuum channel on the top left, and a color map of local concentrations (arbitrary 0%–100%) at the plane of the bottom of the microjets. (b) Concentration profile in the YZ cross-section of the device shows that there is ∼22% concentration at 10 μm above the trench floor. Note that the y distance is from the vacuum outlet to the focal inlet. (c) Simulated linescans at a constant focal channel flow rate of 100 μl/h, and 7 varying flanking channel flow rates ranging from 25 μl/h to 1200 μl/h. (d) Predicted flow velocity profile along y (z = 0) and at 10 μm above the trench floor for various vacuum channel pressures. (e) Predicted flow velocity profile along y (z = 0) and at 10 μm above the trench floor for various trench depths.

