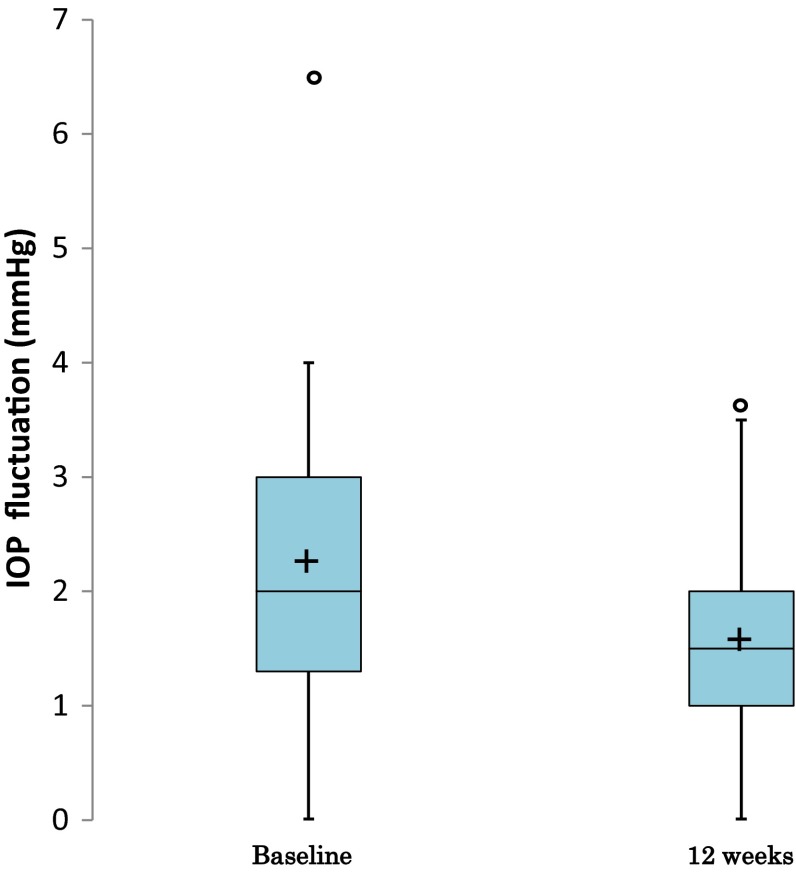
Fig. 2.
Box plot of IOP fluctuation. The box shows the 75th percentile, 50th percentile (median), and 25th percentile. “+” is the mean. Whiskers show the maximum and minimum values within 1.5× the IQR from the 75th percentile or 25th percentile. “o” is an observation beyond 1.5× the IQR from the 75th percentile or 25th percentile. If no “o” exist, the whiskers are the maximum and minimum. IOP intraocular pressure, IQR interquartile range

