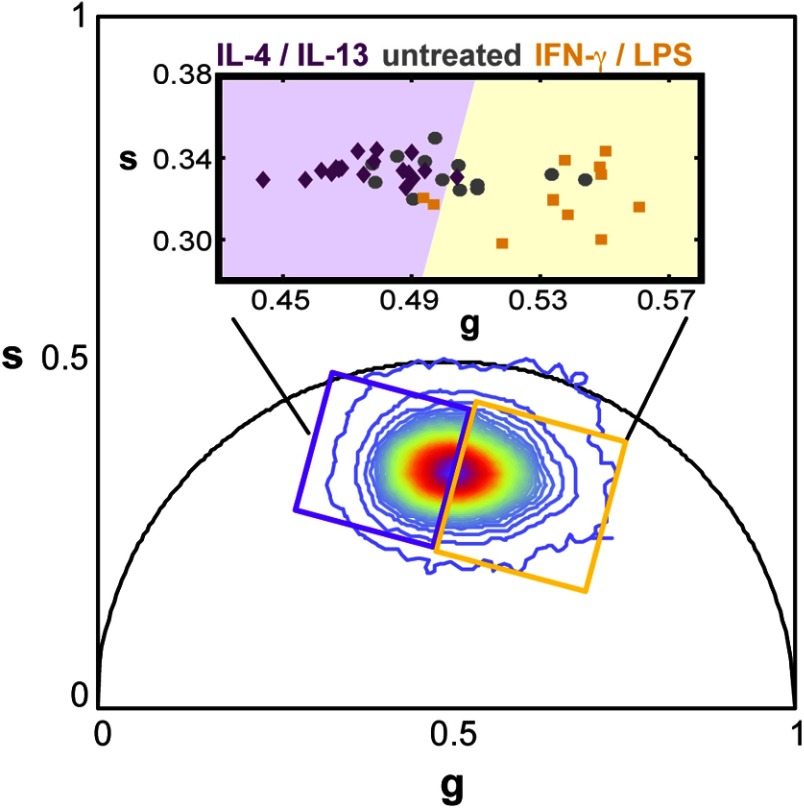
Fig. 4.
Cell phasor plots. The phasor plot agglutinates the lifetime distributions of the cells in the untreated and the polarized macrophages. The purple and yellow squares are located in the same position for the entire analysis. The insert zooms into the core of the phasor to show the average phasor point of each cell analyzed across separate macrophage cultures. The shaded areas align with the squares position.

