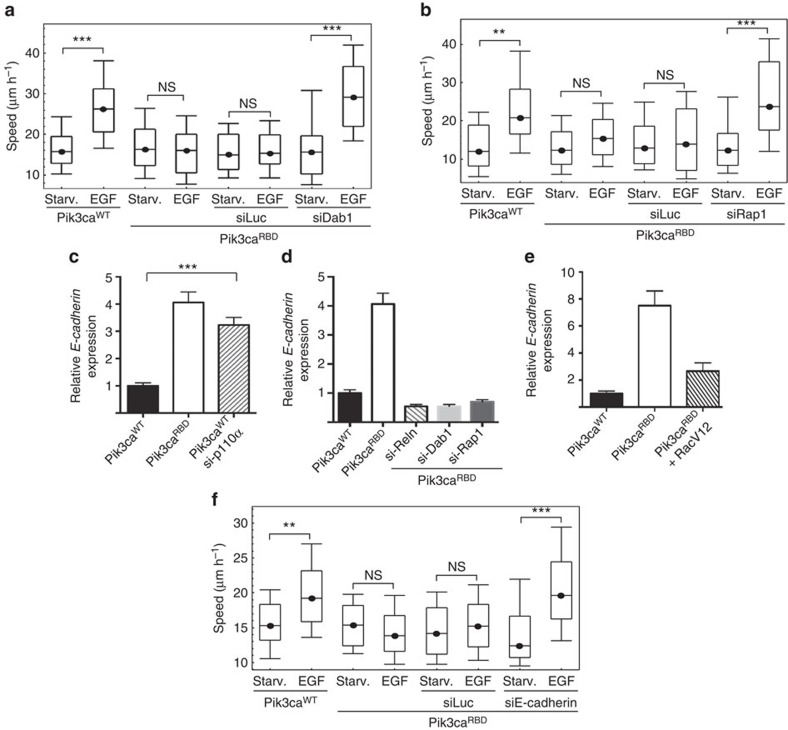
Figure 5. The Reelin pathway regulates migration in Pik3caRBD cells.
(a) Random migration after dab1 silencing in Pik3caRBD cells. Migration was analysed by time-lapse video microscopy and cell tracing in the presence or absence of EGF (20 ng ml−1). Box and whisker plot was generated as indicated for Fig. 1a. Analysis of variance (ANOVA) statistical analysis was performed with starved cells used as reference for each condition (NS, not significant; ***P<0.001). (b) Random migration after Rap1 silencing in Pik3caRBD cells. Migration assay was performed and analysed as described for previous panel. ANOVA statistical analysis was performed with starved cells used as reference for each condition (NS, not significant; **P<0.01; ***P<0.001). (c) Representative graph showing Cdh1 expression levels in Pik3caWT, Pik3caRBD and Pik3caWT cells 72 h after silencing of p110α. Actin expression was used as an internal control for normalization. The assay was performed three times and each time it was performed in triplicates. Error bars indicate mean±s.e.m. (Significance using Student's t-test ***P<0.001). (d) Representative graph showing Cdh1 expression levels in Pik3caRBD cells 72 h after silencing of Reln, Dab1 or Rap1. Actin expression was used as an internal control for normalization. The assay was performed three times and each time it was performed in triplicates. Error bars indicate mean±s.e.m. (e) Representative graph showing Cdh1 expression levels in Pik3caWT, Pik3caRBD and Pik3caRBD RacV12 cells. Actin expression was used as an internal control for normalization. The assay was performed three times and each time it was performed in triplicates. Error bars indicate mean±s.e.m. (Significance using Student's t-test ***P<0.001). (f) Random migration after Cdh1 silencing in Pik3caRBD cells. Migration assay was performed and analysed as described for a). Box and whisker plot was generated as indicated for Fig. 1a. ANOVA statistical analysis was performed with starved cells used as reference for each condition (NS, not significant; **P<0.01).

