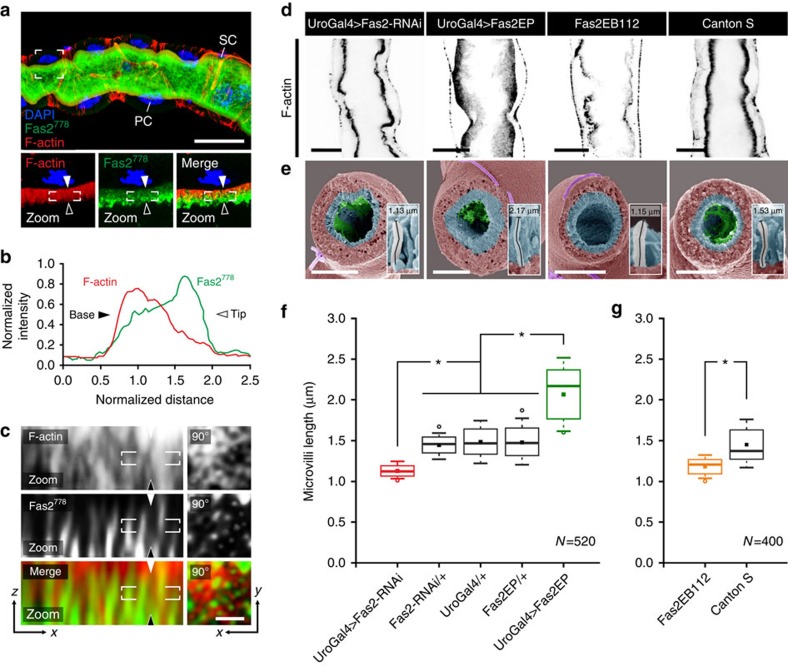
Figure 3. Genetic manipulation of Fas2 impacts microvilli length.
(a) Super-resolution confocal microscopy (Airyscan) on MT from Fas2–GFP778 stained with anti-GFP, suggests that Fas2 localizes to the brush border, where it appears concentrated distally. Zoom: single optical section of the indicated region shown as separate and merged signals. Arrows indicate base (solid) and tip (line) orientations of the brush border. PC, principal cell; SC, stellate cell. Scale bar, 25 μm. (b) Mean normalized fluorescent intensity profiles for F-actin and Fas2 signals from N=12 brush border regions confirm that Fas2 is concentrated at the distal tip of the F-actin-based protrusions. (c) Magnification of the white square in ‘a zoom', and a perpendicular view (‘90°') on the brush border, suggests that Fas2 does not strictly colocalize with intracellular F-actin (phalloidin), but is positioned extracellularly between individual microvilli. Scale bar, 0.5 μm. (d) Inverse coloured optical sections of Alexa-488-phalloidin (black) stained MTs from Fas2 knockdown flies (Fas2-RNAi and Fas2EB112) showed a marked decrease in length and density of the microvillar brush border compared with WT (Canton S) tubules. Conversely, overexpression of Fas2 (Fas2-EP) produced notably longer and denser microvilli. Scale bars, 15 μm. (e) Scanning electron microscopy (SEM) analysis of MT cross-sections (brush border pseudo-coloured in cyan) from adult Drosophila using the principal cell-specific UroGAL4 driver to drive both RNAi and overexpressor constructs confirmed these results. Individual microvilli were measured (see inserts) from (N=10–13) cross-sections with (N=400–520) microvilli measured in total for each Fas2 genetic background. Scale bars, 20 μm. (f,g) Tukey box and whisker plots of microvilli length from the different Fas2 genetic backgrounds. Genetic manipulations of Fas2 expression levels significantly reduced or increased (*, one-way ANOVA, P<0.05) microvilli length compared with parentals or WT. Solid squares indicate mean values; open circles symbolize data outliers.

