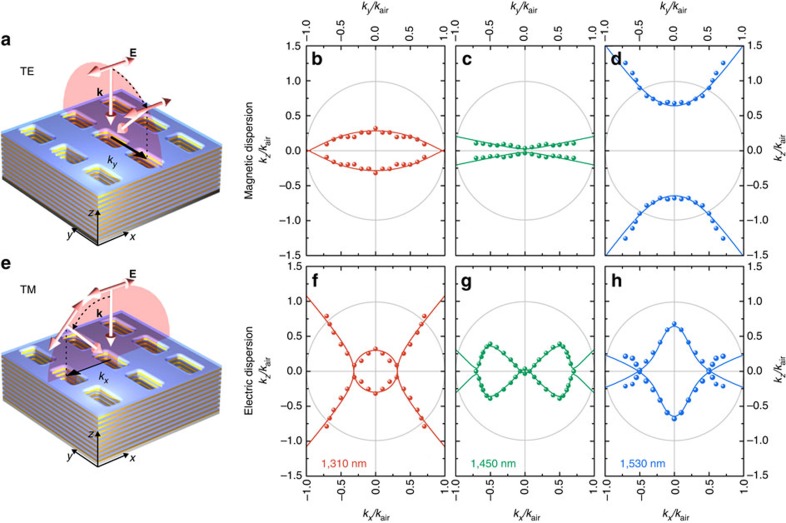
Figure 3. Experimental observation of a transition from elliptic to hyperbolic dispersion.
(a) Sketch of the TE illumination geometry showing relative orientations of the sample, wave vector k and electric field E. (b–d) Isofrequency dispersion contours for the TE polarization at wavelengths 1,310, 1,450 and 1,530 nm, respectively. Wave vector components ky and kz are normalized by the length of the wave vector in air kair. (e) Sketch of the TM illumination geometry. (f–h) Isofrequency dispersion contours for the TM polarization at wavelengths 1,310, 1,450 and 1,530 nm, respectively. Dots mark experimental data, and lines correspond to analytical results. Grey circles correspond to the isofrequency contour of light in vacuum.

