
Fig. 4.
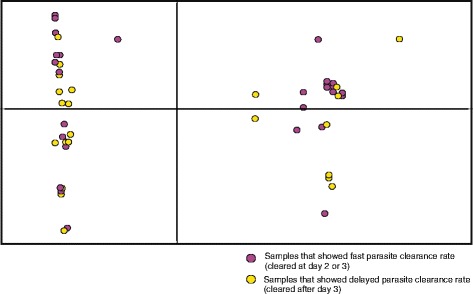
Scatter plot based on Principal Component Analysis (PCA) of microsatellite data among the fast (purple color; no parasite detected at day-3) and delayed (yellow color; parasite detected after day-3) clearance samples of P. falciparum
Official websites use .gov
A
.gov website belongs to an official
government organization in the United States.
Secure .gov websites use HTTPS
A lock (
) or https:// means you've safely
connected to the .gov website. Share sensitive
information only on official, secure websites.
Scatter plot based on Principal Component Analysis (PCA) of microsatellite data among the fast (purple color; no parasite detected at day-3) and delayed (yellow color; parasite detected after day-3) clearance samples of P. falciparum