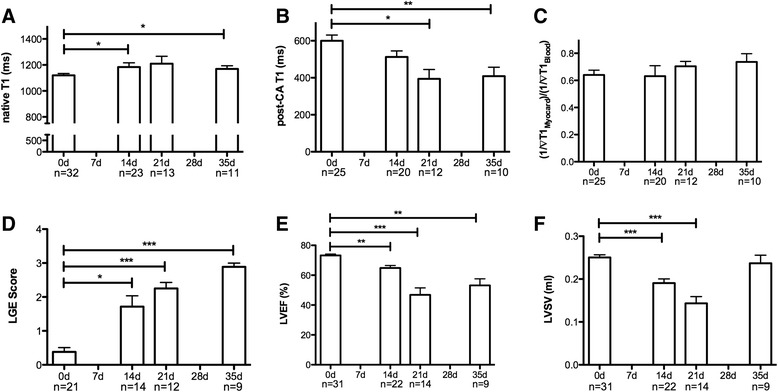
Fig. 1.

Functional and morphological CMR results in EAM. Bar graphs show changes in native T1 (a), post-contrast T1 (b), partition coefficient (c), LGE Score (d), LVEF (e) and LVSV (f) between rats before immunization (day 0), 14, 21 and 35 days after immunization. Results are presented as the mean ± SEM. *p < 0.05, **p < 0.01, ***p < 0.001 vs. 0d
