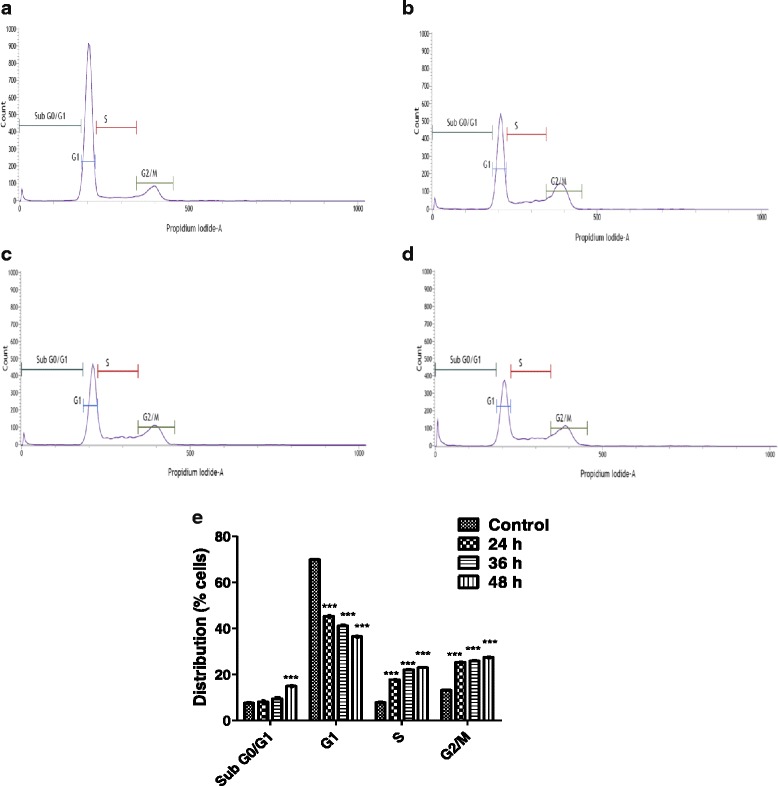
Fig. 3.

Cell cycle histograms of the DNA content of MDA-MB-231 in response to andrographolide. Cells were incubated for 24 (b), 36 (c) and 48 (d) h time points in the absence (control, 48 h) (a) or presence of andrographolide (30 μM), prepared for FACS analysis, as described in Materials and Methods, and analyzed in FACSVerse™ (Becton Dickinson, USA) flow cytometer. The number of cells in each phase of the cell cycle was obtained by using FACSuite™ software. e The percentage of cells in each phase was shown as the mean ± S.D. from three independent experiments (*P < 0.05, **P < 0.01 and ***P < 0.001)
