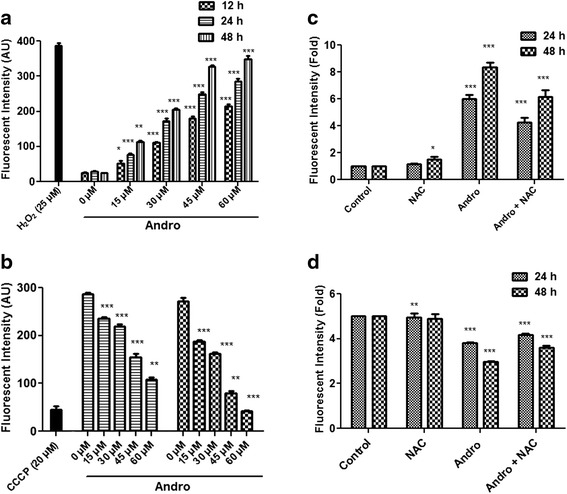
Fig. 5.

Effect of different concentrations of andrographolide on production of ROS and MMP in MDA-MB-231 cells. a Cells were treated with different concentrations (0–60 μM) of andrographolide and incubated for 12, 24 and 48 h. 25 μM H2O2 was used as a positive control. Cells were stained with 2′,7′-dichlorofluorescein diacetate and the production of intracellular H2O2 was measured using a spectrofluorometer as described in materials and methods. Values are mean ± S.D. and represent one of the three independent experiments (*P < 0.05, **P < 0.01 and ***P < 0.001). b Effect of andrographolide on mitochondrial transmembrane potential (∆ψm) in MDA-MB-231 cells after treatment with different concentrations (0–60 μM) of compound for 24 and 48 h. An uncoupling agent CCCP (20 μM) was served as positive control. MMP was measured by spectrofluorometer using a fluorescent probe Rhodamine 123. Values are mean ± S.D. and represent one of the three independent experiments (*P < 0.05, **P < 0.01 and ***P < 0.001). c-d MDA-MB-231 cells were pretreated with or without 3 mM NAC for 1 h followed by 30 μM andrographolide for 24 and 48 h and quantified for ROS production (c) and loss of ∆ψm (d). Fold changes were determined relative to control. Values are mean ± S.D. and represent one of the three independent experiments (*P < 0.05, **P < 0.01 and ***P < 0.001)
