Fig. 10.

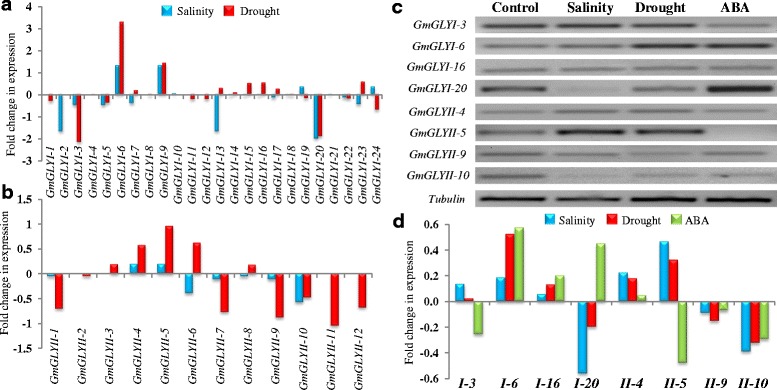
Expression analyses of soybean glyoxalase genes in response to salinity, drought and hormonal treatment. Relative expression data of all available GmGLYI (a) and GmGLYII (b) genes under salinity and drought stresses were obtained from the National Center for Biotechnology Information GEO database (http://www.ncbi.nlm.nih.gov/geo/). Expression data is presented as fold-change by comparing with the corresponding mock samples. Blue colour bar represents data for salinity stress, while red colour indicates drought stress. c Semiquantitative RT-PCR of four GmGLYI genes (GmGLYI-3, GmGLYI-6, GmGLYI-16 and GmGLYI-20), four GmGLYII genes (GmGLYI-4, GmGLYI-5, GmGLYI-9 and GmGLYI-10) and one house-keeping control gene, Tubulin under different conditions such as control, salinity, drought and ABA treatment. d Relative expression analysis of the representative eight glyoxalase genes were analyzed by measuring the PCR band intensity using Image J software and represent as relative fold change in expression
