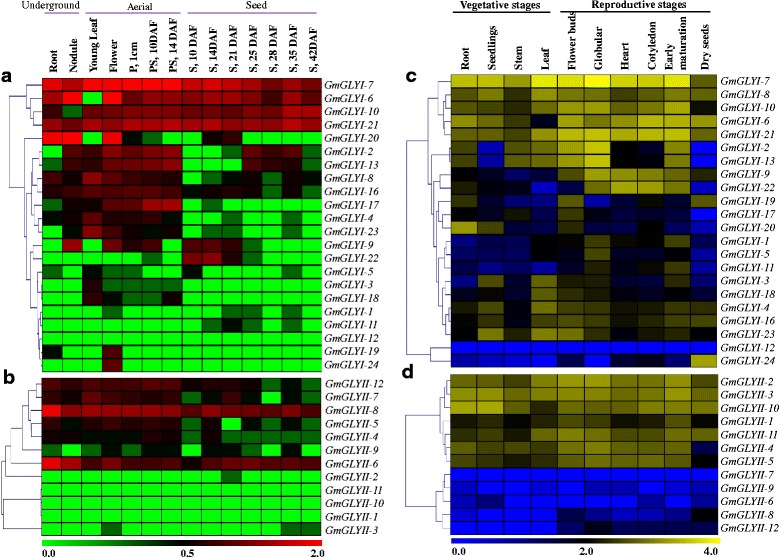
Fig. 9.

Expression profiling of Soybean glyoxalase genes with hierarchical clustering in different developmental tissues and stages. a, b RNA-seq expression data of 14 developmental tissues, such as R (root), N (nodule), YL (young leave), F (flower), P.1 cm (one cm pod), PS.10d (pod shell 10DAF), PS.14d (pod shell 14DAF), S.10d (seed 10DAF), S.14d (seed 14 DAF), S.21d (seed 21DAF), S.25d (seed 25DAF), S.28d (seed 28DAF), S.35d (seed 35DAF), S.42d (seed 42DAF) was used in the analysis. The normalized data was downloaded from soybase (http://soybase.org/soyseq/) and provided as Additional file 2: Table S5. Heatmap generation and hierarchical clustering was performed using MeV software package. The colour scale below the heat map indicates expression values; green indicates low transcript abundance while red indicates high level of transcript abundance. c, d Transcriptome data of all GmGLYI and GmGLYII genes at various developmental stages (indicated at the top of each lane) were obtained from the National Center for Biotechnology Information (http://www.ncbi.nlm.nih.gov/geo/query/acc.cgi?acc=GSE29163). Heatmaps generation and hierarchical clustering were performed using MeV software package. The colour scale given below the heat map indicates the expression values where blue indicates low transcript abundance and yellow indicates high transcript abundance
