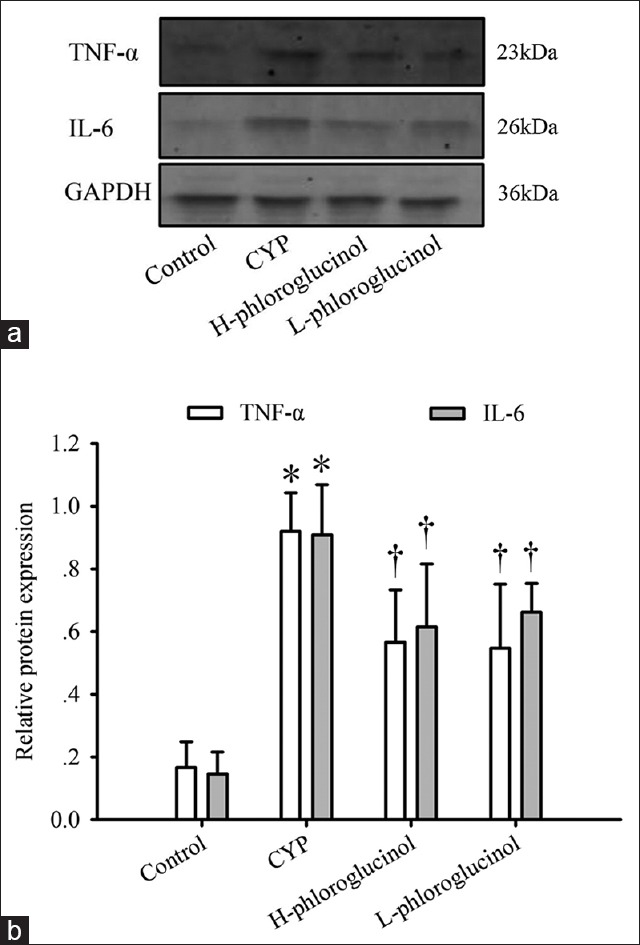
Figure 4.

Effect of phloroglucinol on cyclophosphamide (CYP)-induced tumor necrosis factor-α (TNF-α) and interleukin-6 (IL-6) protein expression. Representative Western blotting images (a) and statistical analysis (b) of TNF-α and IL-6 are shown. Values are expressed as the mean ± standard error, n = 8. *P < 0.01 (vs. the control group), †P < 0.01 (vs. the CYP-treated group).
