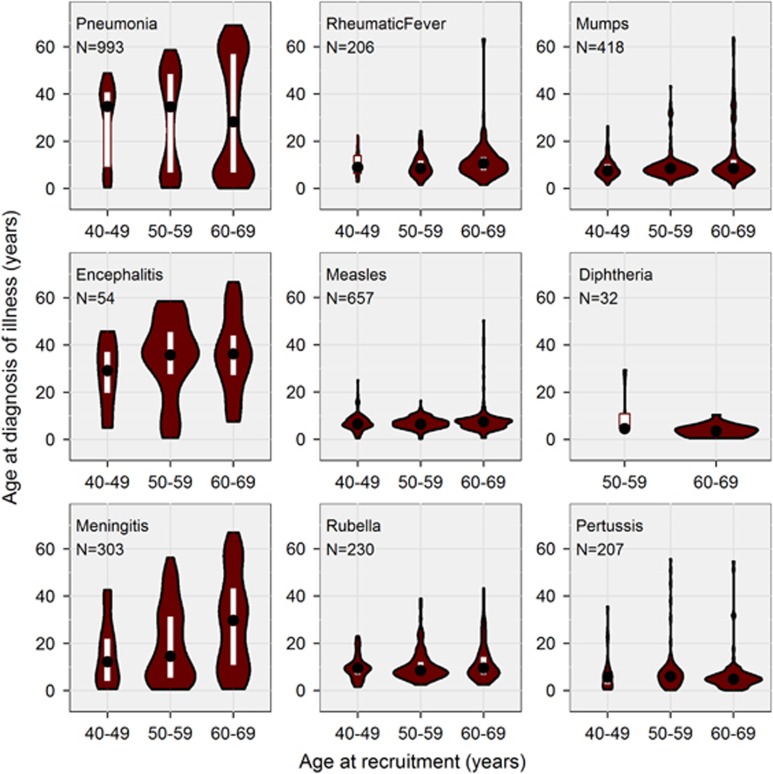
Figure 1.
Violin plots showing age at diagnosis of febrile illnesses as a function of age at recruitment. Each panel shows the median (black circle), interquartile range (white rectangle), and the frequency distribution (smoothed histogram with brown shading, mirrored vertically; width proportional to number of affected participants in that age caetgory) of the age at diagnosis, by category of age at recruitment. The total number of cases across all three age categories is indicated (N). The analysis was restricted to White participants aged 40–69 rears with valid autorefraction information (N=91 592).

